Crude oil price forecast: US-Iran talks, Hormuz flows
Crude oil prices remain shaped by US–Iran talks, disruption in the Strait of Hormuz, with WTI and Brent both reacting to shifting geopolitical and production signals. Explore third-party crude oil price targets and technical analysis. Past performance is not a reliable indicator of future results.
US Crude Oil (US Crude) was trading at $86.767 on Capital.com's feed as of 10:39am UTC on 21 April 2026, ranging between $85.832 and $88.462 intraday, while Brent Crude Oil (Brent Crude) was quoted at $91.48, within a $90.184–$93.160 range. Past performance is not a reliable indicator of future results.
Oil prices declined in early European trading on Tuesday amid expectations that peace talks between the US and Iran will proceed this week, raising the prospect of fewer supply disruptions through the Strait of Hormuz, which has seen vessel transits fall well below its historical average of 138 daily crossings since the closure on 4 March 2026 (CNBC, 20 April 2026). The two-week US–Iran ceasefire is due to expire on Wednesday, with a senior Iranian official reported to be considering participation in a fresh round of negotiations in Pakistan, tempering the supply-risk premium that drove Monday's rally (Reuters, 20 April 2026).
Crude oil price forecast 2026-2030: Analyst price target view
As of 21 April 2026, third-party crude oil predictions have been adjusted, as the persistence of Strait of Hormuz supply disruptions has continued to force upward revisions across bank research desks.
WTI forecasts
Goldman Sachs (Q2 and Q4 2026 revised outlook)
Goldman Sachs sets its April 2026 WTI average at around $79/bbl, consistent with its full-year WTI forecast of $79/bbl published in late March, while projecting a Q4 2026 base case of $67/bbl for WTI as supply disruptions ease in the second half. The bank describes the Hormuz closure as the largest supply shock ever recorded in the global crude market, with Q2 2026 bearing the peak price impact before rerouting and normalisation partially offset the shortfall (The Street, 14 March 2026).
Morgan Stanley (mid-cycle WTI view, maintained April 2026)
Morgan Stanley leaves its WTI mid-cycle price assumption at $70/bbl, raised from $65/bbl following a 44% upward revision to its 2026 WTI price deck on 25 March. The bank assumes Hormuz exports remain subdued through April, recover approximately 70% of the decline during May–July, and return to more stable levels only by October 2026, keeping near-term WTI elevated relative to the mid-cycle marker (Sahm Capital, 13 April 2026).
Citi (3-month WTI target)
Citigroup sets a three-month target price for WTI crude at approximately $104/bbl in its March 2026 research note, alongside a short-term Brent baseline of $110–$120/bbl. The bank expects the Middle East conflict to begin easing in mid-to-late April 2026, with WTI and Brent then retracing towards $70–$80/bbl by end-2026 in its base case scenario (TradingKey, 18 March 2026).
Brent forecasts
Barclays (2026 full-year Brent, risk-skewed)
Barclays holds a full-year 2026 Brent forecast of $85/bbl, noting that this figure is consistent with rapid normalisation of Strait of Hormuz flows, while flagging that delays or further escalation would push the average materially higher. Analyst Amarpreet Singh notes that Hormuz transit flows have remained subdued despite the ceasefire, with supply disruptions running at an estimated 13–14 million barrels per day, skewing the risk to the upside (OE Digital Energy News, 9 April 2026).
Morgan Stanley (Q2 and Q3 2026 Brent, maintained)
Morgan Stanley leaves its Brent forecast unchanged at $110/bbl for Q2 2026 and $100/bbl for Q3 2026, before easing to around $80/bbl in 2027. The bank expects oil supply chains to take months to normalise even if a Hormuz reopening is achieved, keeping the near-term price premium intact well into the third quarter (Sahm Capital, 13 April 2026).
Citi (Q2 2026 Brent baseline and bull scenario)
Citigroup projects Q2 2026 average Brent at $95/bbl in its baseline scenario and $130/bbl under a bullish scenario, as reported on 1 April 2026. Citi notes that global oil supply may face a shortfall of around 4.4 million barrels per day, rising to 8 million barrels per day if several Gulf states refuse to accept Iran's proposed Strait transit arrangements, widening the spread between the baseline and bull-case outcomes considerably (Binance News, 1 April 2026).
Predictions and third-party forecasts are inherently uncertain, as they cannot fully account for unexpected market developments. Past performance is not a reliable indicator of future results.
Crude oil prices: Technical overview
US Crude Oil (WTI)
US Crude’s price trades at $86.767 as of 10:39am UTC on 21 April 2026, sitting in a technically split position: price holds above the longer-dated 50/100/200-day SMAs at around $85 / $72 / $68, which collectively act as a structural support shelf, while trading below the shorter 20-day SMA at around $97. The 20-over-50 SMA alignment is not intact, with the 20-day SMA well above current price and the shorter-term cluster all registering sell signals, reflecting the recent corrective move from recent highs. The 14-day RSI reads 45.12, which is within a neutral zone, while the ADX at 33.32 suggests that an established trend is in force, suggesting the prevailing move carries directional conviction rather than noise.
On the topside, the Classic Pivot at $96.69 is the first reference to reclaim; a daily close above this level would bring R1 near $124.17 into view as the next meaningful level. The $100 figure sits between P and R1 and would likely act as an intervening test before any sustained advance towards R1.
On pullbacks, the 50-day SMA near $85 offers the nearest structural floor, with the intraday low of $85.832 already having tested that region on 21 April. A close below that shelf would raise the risk of a slide towards S1 at $73.89, where the Classic and Fibonacci pivot bands converge (TradingView, 21 April 2026).
This is technical analysis for informational purposes only and does not constitute financial advice or a recommendation to buy or sell any instrument.
Brent Crude Oil
Brent Crude’s price trades at $91.48 as of 10:39am UTC on 21 April 2026, showing a similar structural picture to WTI: price holds above the 50/100/200-day SMAs at around $90 / $77 / $72 but remains below the 20/30-day SMAs near $100–$101, where the sell-aligned shorter-term cluster has capped recent rallies. The 50-day SMA at $90.34 is the nearest dynamic reference and broadly aligns with the session low of $90.184, underlining its immediate relevance. The 14-day RSI at 48.46 sits in neutral territory, and the ADX at 28.51 points to an established trend, indicating the current move has sufficient momentum to persist rather than drifting without direction.
To the upside, the Classic Pivot at $99.74 is the first level to watch; a daily close above that mark would open the $100–$100.24 area, where the 20-day SMA and the Woodie Pivot cluster, before R1 near $123.73 comes into scope. The $100 figure is the more psychologically significant near-term test.
On the downside, the 50-day SMA near $90 is the first meaningful support, given that the intraday price stands around $91.48. Losing that level on a closing basis would shift attention towards S1 at $79.98, with the Fibonacci pivot at $83.03 offering an intermediate reference on the way down (TradingView, 21 April 2026).
This is technical analysis for informational purposes only and does not constitute financial advice or a recommendation to buy or sell any instrument.
Crude oil price history (2024–2026)
US Crude Oil (WTI)
The US Crude price was trading around $82–$84/bbl in April 2024, briefly climbing to an intraday high of $84.07 on 5 July 2024 before a prolonged sell-off took hold. Prices fell sharply through the second half of 2024, with WTI closing the year at $57.35 on 31 December 2024, down roughly 30% from the July peak. The decline continued into early 2025, touching a low near $54.86 on 9 April 2025.
WTI stabilised and traded in a fairly narrow $57–$79 range for much of 2025, closing the year around $57.35 on 31 December. The picture changed dramatically in early 2026: the closure of the Strait of Hormuz on 4 March 2026 sent WTI to an intraday peak of $115.78 on 9 March, its highest level in the dataset. Prices then retraced sharply as ceasefire hopes emerged, falling back towards the high $80s by mid-April.
WTI closed at $86.75 on 21 April 2026, approximately 51.1% higher year to date and 37.7% higher year on year.
Past performance is not a reliable indicator of future results. Prices are indicative and may differ from live market prices.
Brent Crude Oil
The Brent Crude price opened April 2024 around $86–$88/bbl before drifting lower through the second half of the year, closing 2024 at $74.82 on 31 December. The benchmark then continued lower into early 2025, hitting an intraday trough of $58.28 on 9 April 2025, with broad supply surplus concerns keeping a ceiling on any recovery.
Brent spent the remainder of 2025 consolidating in the low-to-mid $60s, ending the year at $60.92 on 31 December. The Hormuz closure in March 2026 triggered a sharp move, with Brent reaching $116.29 intraday on 9 March 2026 before retreating. By mid-April, prices had pulled back to the low $90s as market participants weighed the pace of potential supply normalisation.
Brent closed at $91.50 on 21 April 2026, approximately 50.2% higher year to date and 39.0% higher year on year.
Past performance is not a reliable indicator of future results. Prices are indicative and may differ from live market prices.
US Crude vs Brent Crude: Capital.com analyst outlook
Crude oil's price performance over the past two years has been defined by two distinct phases: a prolonged, orderly decline through 2024 and most of 2025, and an abrupt, supply-shock-driven reversal in early 2026. WTI and Brent both shed roughly 30% between mid-2024 and end-2025 as OPEC+ output increases and softer global demand weighed on the market. The Strait of Hormuz closure in March 2026 then triggered one of the sharpest single-event rallies in recent memory, with both benchmarks briefly surging above $115/bbl before retracing as ceasefire and diplomatic signals emerged.
From here, the direction of travel depends largely on how quickly, and how durably, Hormuz transit flows normalise. A faster-than-expected resolution could unwind much of the geopolitical premium and push prices back towards the $70–$80/bbl range that prevailed through 2025, while a prolonged disruption or fresh escalation could sustain or extend current elevated levels.
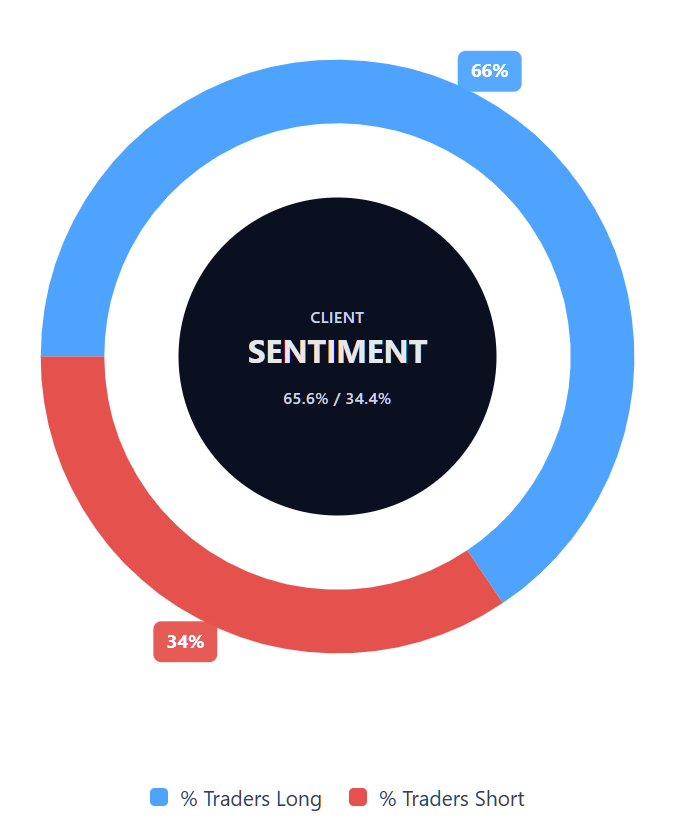
Capital.com’s client sentiment for US Crude CFDs
As of 21 April 2026, Capital.com client positioning in US Crude CFDs stands at 65.6% buyers vs 34.4% sellers, which keeps the market in majority-buy territory, though not at an extreme level. This snapshot reflects open positions on Capital.com at the time of capture and is subject to change as market conditions evolve.
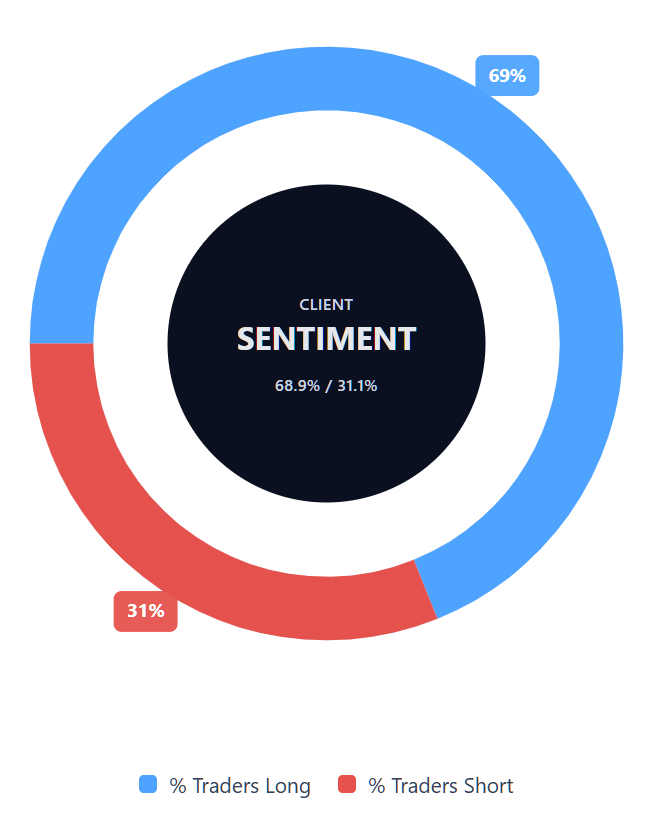
Capital.com’s client sentiment for Brent Crude CFDs
As of 21 April 2026, Capital.com client positioning in Brent Crude CFDs stands at 68.9% buyers vs 31.1% sellers, a gap that sits at the upper end of majority-buy territory and approaches more concentrated long positioning. This snapshot reflects open positions on Capital.com at the time of capture and is subject to change as market conditions evolve.
Summary – US Crude and Brent Crude (2026)
- WTI trades at $86.767 as of 10:39am UTC on 21 April 2026; WTI briefly hit $115.78 intraday on 9 March 2026 following the Strait of Hormuz closure; prices have since retraced into the mid-to-high $80s.
- Brent trades at $91.48 as of 10:39am UTC on 21 April 2026, up approximately 50% year to date and 39% year on year; an intraday high of $116.29 was reached on 9 March 2026 following the Hormuz closure; Brent has since pulled back to the low $90s as diplomatic signals emerged.Key price drivers include US–Iran ceasefire negotiations, the pace of Hormuz flow normalisation, and broader macro sentiment.
Past performance is not a reliable indicator of future results.
FAQ
What is the crude oil price forecast?
There is no single crude oil price forecast, as third-party projections vary widely by benchmark, timeframe and scenario. In the article, institutional forecasts for WTI range from $67–$104/bbl, while Brent estimates range from $85–$130/bbl. Much depends on how quickly Strait of Hormuz flows recover, whether geopolitical tensions ease further, and how additional OPEC+ supply affects the market. Forecasts can change quickly as new data and events emerge.
Could crude oil’s price go up or down?
Crude oil prices can move in either direction, often in response to several drivers at once. In the current market, key factors include US–Iran negotiations, the pace of any recovery in Strait of Hormuz shipping flows, OPEC+ supply decisions, and broader macroeconomic conditions. If supply disruption eases, prices could fall back. If tensions escalate or flows remain constrained, prices could stay elevated or move higher. Volatility can remain high in both directions.
Should I invest in crude oil?
Whether crude oil is suitable for you depends on your objectives, risk tolerance and trading strategy. Crude oil can be highly volatile, and prices may react sharply to geopolitical events, supply developments and changes in demand expectations. That means opportunities may arise, but so can significant losses. This article is for informational purposes only and does not provide investment advice. If you are considering trading or investing, it’s important to understand the risks and the product first.
Can I trade crude oil CFDs on Capital.com?
Yes, you can trade US Crude CFDs and Brent Crude CFDs on Capital.com. Trading commodity CFDs lets you speculate on price movements without owning the underlying asset and to take long or short positions. However, contracts for difference (CFDs) are traded on margin, and leverage amplifies both profits and losses. You should ensure you understand how CFD trading works, assess your risk tolerance, and recognise that losses can occur quickly.