Gold price forecast: Fed minutes and US yield pressure
Gold spot trades near a one-week low as higher US yields, a firmer dollar and US–Iran tensions shape expectations for Federal Reserve policy. Explore third-party Gold price targets and technical analysis. Past performance is not a reliable indicator of future results.
Gold (XAU/USD) is trading at $4,552.26 as of 1:29pm UTC on 18 May 2026, within a session range of $4,494.18–$4,662.24. Past performance is not a reliable indicator of future results.
Pressure has carried into the new week as rising US Treasury yields, with the 10-year benchmark near a one-year high, continue to increase the opportunity cost of holding non-yielding bullion (CNBC, 15 May 2026). A firmer US dollar has also made gold more expensive for buyers using other currencies (Reuters, 15 May 2026). Sustained US–Iran tensions in the Middle East have reinforced inflation concerns, which may reduce expectations for near-term Federal Reserve rate cuts and keep hawkish rate bets in focus (Modern Diplomacy, 12 May 2026). Central bank demand, including net purchases of 244 tonnes reported through Q1 2026 – up 3% year on year – provides an underlying support layer, though it has not been sufficient to offset near-term pressure from real yields and dollar strength (World Gold Council, 29 April 2026).
Gold forecast: rate expectations shape third-party forecasts
As of 18 May 2026, third-party gold predictions show a wide range of views, shaped by differing assumptions around US monetary policy, central bank demand, geopolitical risk, and investor positioning.
J.P. Morgan (annual average, revised lower)
J.P. Morgan lowered its 2026 average gold price forecast to $5,243/oz from $5,708/oz, citing softer near-term investor demand after client interest 'dried to a trickle.' The bank still expects prices to recover toward $6,000 by year-end, with demand re-accelerating in the second half of 2026 on continued central bank reserve diversification and improving ETF flows (Reuters, 2 February 2026).
ANZ (year-end target, trimmed)
ANZ trimmed its year-end gold price target to $5,600/oz, moving its previous $6,000 target to mid-2027 from early 2027. The bank linked the revision to persistent inflation expectations, elevated US Treasury yields, and a stronger dollar, which it sees pressuring gold in the near term before structural demand becomes more influential (MarketScreener, 18 May 2026).
International Business Times (consensus overview)
IBTimes, drawing on the April 2026 Reuters survey of 31 analysts and major bank targets then in force, reported that the median consensus forecast sits near $4,916/oz for the 2026 annual average – below J.P. Morgan's year-end target of $6,300 and Goldman Sachs's $5,400. The article notes that the gap between conservative consensus estimates and higher bank targets reflects different assumptions about the pace of Federal Reserve rate cuts and the durability of central bank buying (International Business Times, 13 May 2026).
Moneymagpie (multi-bank summary)
Moneymagpie's survey of major institutional views notes that Goldman Sachs holds a year-end 2026 target of $5,400/oz, while UBS maintains a base case near $5,900 with an upside scenario of $6,200, both citing ETF demand, central bank accumulation, and geopolitical risk as key drivers. More cautious consensus estimates in the $4,700–$5,000 range assume interest rates remain relatively elevated and investor demand becomes less aggressive through the second half of the year (Moneymagpie, 7 May 2026).
Predictions and third-party forecasts are inherently uncertain, as they cannot fully account for unexpected market developments. Past performance is not a reliable indicator of future results.
Gold spot: key macro releases to watch
Several scheduled data points and event risks could affect gold spot (XAU) in the coming days, given the metal's sensitivity to US rate expectations, dollar direction, and safe-haven demand.
FOMC minutes (21 May 2026): The May meeting minutes are due on 21 May 2026. Markets will focus on language around inflation persistence and rate-cut timing; a hawkish tone could reinforce the real-yield pressure that has weighed on gold through mid-May, with the US 10-year Treasury yield closing at 4.59% on 15 May 2026 – its highest level in recent months – while a dovish reading could reduce the opportunity cost of holding non-yielding bullion (US Treasury, 15 May 2026).
UK CPI (21 May 2026): The Office for National Statistics releases April inflation data on 21 May 2026. A materially elevated reading could reinforce global inflation narratives and support gold's role as an inflation hedge across multi-currency portfolios (Reuters, 15 May 2026).
US flash PMI and jobless claims (22 May 2026): S&P Global's preliminary May composite PMI and weekly initial jobless claims are both due on 22 May 2026; weaker readings on either metric would typically feed into Federal Reserve rate-cut expectations, which remain a key near-term variable for gold pricing, with the most recent claims print showing initial filings at 200,000 for the week ending 2 May 2026 (The Washington Post, 7 May 2026).
Geopolitical risk: US–Iran nuclear negotiations and broader Middle East ceasefire developments have no fixed schedule but remain live event risks; any breakdown in talks has, as observed in April and early May 2026, prompted immediate safe-haven demand into gold (Modern Diplomacy, 12 May 2026).
Gold price: Technical overview
Gold spot prices trades at $4,552.26 as of 1:29pm UTC on 18 May 2026, sitting below all four key daily moving averages. The 20/50/100/200-day SMAs are clustered between $4,649–$4,794, creating a potential area of overhead resistance. Price is also beneath the Ichimoku baseline at $4,685.98 and the volume-weighted moving average at $4,646, consistent with softer near-term momentum conditions visible across TradingView’s moving average panel.
Momentum indicators point in a similar direction. The 14-day RSI reads 40.62, a lower-neutral reading that reflects softer momentum but does not yet indicate oversold conditions. The MACD level (12, 26) sits at −31.59, below its signal line. The Hull moving average (9) at $4,571.60 has also turned lower, consistent with near-term selling pressure.
On the upside, the classic pivot point at $4,674.57 is the nearest reference. A daily close above that level would put R1 at $4,839.04 in view, with R2 near $5,056.01 as the next broader level. On pullbacks, S1 at $4,457.59 is the initial classic support reference, with the 200-day SMA at $4,348.29 representing the deeper moving-average shelf. A sustained move below S1 would risk a test of that longer-term level (TradingView, 18 May 2026).
This technical analysis is for informational purposes only and does not constitute financial advice or a recommendation to buy or sell any instrument.
Gold price history (2024–2026)
The gold spot price traded near $2,420 in May 2024, consolidating after a brief spike to $2,450 on 20 May amid softer US dollar conditions. Prices then moved in a relatively tight $2,290–$2,480 band through summer 2024 before climbing into autumn, with a move above $2,700 in October coinciding with pre-US election safe-haven demand.
Gold closed 2024 near $2,625 and built on that base in 2025. A steady rise carried prices through $3,000 for the first time in March 2025, before an April sell-off – coinciding with broader market volatility and tariff uncertainty – briefly pulled the metal towards $2,972 on 9 April. The price later recovered, with gold trading in the $3,400–$3,800 range by late summer and autumn as central bank demand and geopolitical risk continued to support haven flows.
The largest moves came in early 2026. Gold reached a record high of $5,598 on 28 January, driven by institutional inflows and safe-haven positioning, before a significant correction pulled prices back. A partial recovery into April faded through May amid rising real yields and dollar strength.
Gold spot (XAU) closed at $4,550.45 on 18 May 2026 – approximately 18.8% below the January 2026 record high, but around 40.8% higher year on year.
Past performance is not a reliable indicator of future results. Prices are indicative and may differ from live market prices.
Gold price outlook: Capital.com analysis
Gold spot (XAU) has recorded a sharp two-year rise, climbing from around $2,420 in May 2024 to a peak of $5,598 in January 2026 before pulling back to current levels near $4,550. The move reflected several supportive forces, including persistent central bank reserve accumulation, elevated geopolitical risk from Middle East tensions, and a broadly softer US dollar environment through much of 2025. However, traders may choose to weigh those tailwinds against the correction that followed the January 2026 peak – a reminder that sharp rallies can unwind quickly when real yields rise, dollar sentiment shifts, or geopolitical risk premiums ease.
More recently, rising US Treasury yields and a firmer dollar have added headwinds, reducing gold’s relative appeal as a non-yielding asset. Some analysts argue that sustained central bank demand and inflation uncertainty provide a degree of underlying support. Others note that easing Middle East tensions or a more hawkish Federal Reserve stance could continue to weigh on prices. The metal’s path from here remains sensitive to competing macro forces pulling in different directions.
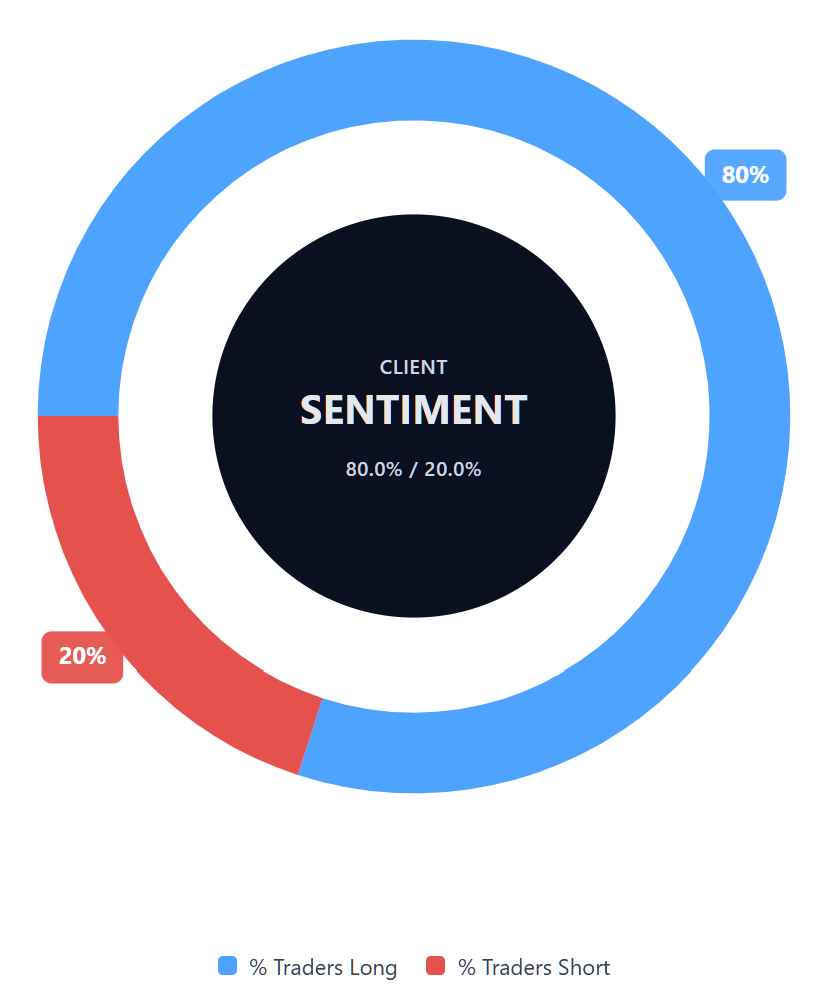
Capital.com’s client sentiment for Gold CFDs
As of 18 May 2026, Capital.com client positioning in Gold spot CFDs shows 80% buyers versus 20% sellers, putting buyers ahead by 60 percentage points. This means positioning is heavily weighted towards long positions. This snapshot reflects open positions on Capital.com and can change rapidly as market conditions evolve.
Summary – Gold price 2026
- Gold spot (XAU) trades at $4,552.26 as of 1:29pm UTC on 18 May 2026, around 18.8% below the January 2026 record high of $5,598, but approximately 40.8% higher year on year.
- Key drivers include rising US Treasury real yields and a firmer dollar, both of which have weighed on gold. Persistent central bank accumulation and geopolitical risk in the Middle East continue to provide underlying support.
- Recent pressure has come from hawkish Federal Reserve repricing and softer investor demand, with J.P. Morgan cutting its 2026 average forecast to $5,243/oz on 18 May 2026 amid declining client positioning.
Past performance is not a reliable indicator of future results.
FAQ
What is the Gold price forecast?
Could Gold’s price go up or down?
Should I invest in Gold?
Can I trade Gold CFDs on Capital.com?
Yes, you can trade Gold CFDs on Capital.com. Trading commodity CFDs lets you speculate on price movements without owning the underlying asset and to take long or short positions. However, contracts for difference (CFDs) are traded on margin, and leverage amplifies both profits and losses. You should ensure you understand how CFD trading works, assess your risk tolerance, and recognise that losses can occur quickly.