Gold price forecast: US–Iran truce deadline, Fed uncertainty
Gold remains supported by haven demand as the US–Iran ceasefire approaches its 22 April deadline, while a weaker US dollar and uncertainty around the Federal Reserve continue to shape price action. Explore third-party XAU price targets. Past performance is not a reliable indicator of future results.
Gold (XAU/USD) is trading at $4,785.23 as of 11:01am UTC on 21 April 2026, within a session range of $4,752.33–$4,827.80. Past performance is not a reliable indicator of future results.
Haven demand continues to underpin bullion amid an unresolved US–Iran ceasefire, with the two-week truce brokered by Pakistan due to expire on 22 April (AP News, 21 April 2026). Iran has publicly signalled limited prospects for an agreement ahead of a further round of talks led by US Vice President JD Vance, after a first round of 21-hour negotiations in Islamabad ended without a deal (Al Jazeera, 12 April 2026). The US Dollar Index (DXY) is trading near 98.13, offering limited relief for dollar-denominated metals (Investing.com, 21 April 2026). Meanwhile, ongoing concerns about Federal Reserve independence, following the Justice Department issuing subpoenas to the Fed under the Trump administration, continue to weigh on the greenback and support safe-haven flows into gold (Investopedia, 12 January 2026). Fed officials have entered their blackout period ahead of the 28–29 April FOMC meeting, with markets broadly pricing in a rate hold, as Polymarket implied probability of no change stands near 99% (Polymarket, 21 April 2026). The Federal Reserve has maintained its target rate in the 3.50%–3.75% range since its March 2026 meeting, where policymakers projected one rate cut for the year (Reuters, 18 March 2026).
Gold price forecast 2026-2030: Analyst price target view
As of 21 April 2026, third-party gold predictions reflect a broad convergence of institutional views shaped by central bank accumulation, Federal Reserve rate expectations, US fiscal risks, and persistent geopolitical uncertainty.
Goldman Sachs (year-end target, reaffirmed)
Goldman Sachs maintains its year-end 2026 gold price target at $5,400/oz, a level first set in January 2026 and reaffirmed through March's sharp correction. Analysts Daan Struyven and Lina Thomas cite central bank purchases running at approximately 60 tonnes per month and expectations of two further US rate cuts. The bank describes the medium-term outlook as intact, with asymmetric risk skewed to the upside, while flagging a bear-case floor of $3,800/oz should the energy supply shock from the Iran conflict worsen (Canadian Mining Report, 17 April 2026).
State Street Global Advisors (base, bull and bear case range)
State Street Global Advisors' Gold Strategy Team carries a base-case year-end range of $4,750–$5,500/oz with a 50% probability, a bull-case range of $5,500–$6,250/oz with a 30% probability, and a bear-case floor of $4,000–$4,100/oz with a 20% probability as of its April 2026 Monthly Gold Monitor. The team frames Q1 2026 as 'down but not out,' noting gold remains in the middle innings of a structural bull cycle, with the oil price shock viewed as a temporary headwind rather than a reversal of structural tailwinds (State Street Global Advisors, 1 April 2026).
GoldSilver.com (institutional consensus overview)
GoldSilver.com's April 2026 survey of institutional forecasts finds that year-end 2026 targets across major banks range from $5,400/oz (Goldman Sachs) to $6,300/oz (J.P. Morgan), with gold trading near $4,867/oz as of 17 April after recovering from March's correction. The report notes that all forecasting institutions have revised targets materially higher since the start of 2025, citing structural demand from central banks, private-sector de-dollarisation flows, and ongoing geopolitical risk as the shared rationale across the consensus (GoldSilver.com, 16 April 2026).
UBP (year-end target, reaffirmed)
Swiss private bank UBP (Union Bancaire Privée), which manages approximately $233 billion in client assets, reaffirmed its year-end 2026 gold target of $6,000/oz on 13 April. Gupta of the Discretionary Portfolio for Asia said that structural demand driven by central bank purchases, fiscal deficit concerns, and geopolitical uncertainty remains robust. UBP is actively rebuilding gold allocations in discretionary client portfolios after reducing exposure during the March sell-off linked to the Iran conflict, with the allocation raised from approximately 3% back towards 6% (TheStreet, 14 April 2026).
Predictions and third-party forecasts are inherently uncertain, as they cannot fully account for unexpected market developments. Past performance is not a reliable indicator of future results.
Gold price: Technical overview
Gold spot prices trades at $4,785.23 in early European trading as of 11:01am UTC on 21 April 2026, sitting just above the 50-day exponential moving average (EMA) at $4,785.31 and broadly in line with the 30-day simple moving average (SMA) at $4,750.31, according to TradingView data. The 100- and 200-day SMAs, at $4,726.02 and $4,225.29 respectively, sit further below and provide a broader long-term floor. The Hull moving average (9) at $4,820.96 runs modestly above the last price, while the 20-day SMA at $4,682.75 trails underneath, which leaves a mixed short-term picture.
The 14-day relative strength index (RSI) registers 50.62, a mid-range neutral reading that reflects neither overbought nor oversold conditions at this stage of the session.
On the upside, the classic R1 pivot at $5,358.65 represents the nearest overhead reference on a TradingView pivot framework; a daily close toward the R1 area would put R2 at $6,049.42 in broader view. On the downside, the classic pivot (P) at $4,728.89 serves as initial support, with the 100-day SMA near $4,726.02 forming a closely aligned shelf just below. A move below that cluster would bring S1 at $4,038.11 into consideration as the next meaningful reference (TradingView, 21 April 2026).
This is technical analysis for informational purposes only and does not constitute financial advice or a recommendation to buy or sell any instrument.
Gold price history (2024–2026)
The gold spot price opened 2025 near $2,624/oz and climbed steadily through the year, crossing $3,000/oz for the first time in March 2025 before consolidating through the summer months in the $3,260–$3,450 range.
The pace of gains accelerated sharply into late 2025 and through early 2026. Gold cleared $4,000/oz in October 2025 and pushed towards $4,500/oz by January 2026, before reaching an intraday high of $5,595.75 on 29 January 2026, which marked the highest point in the dataset. A correction followed, with prices sliding back through February and into March 2026, touching lows near $4,098 on 23 March before recovering.
Gold spot closed at $4,785.67 on 21 April 2026, up approximately 82.3% year on year from the $2,624.01 close recorded on 1 January 2025, and roughly 10.5% below the January 2026 spike high of $5,595.75.
Past performance is not a reliable indicator of future results. Prices are indicative and may differ from live market prices.
Gold price outlook: Capital.com analysis
Gold spot (XAU) has been one of the standout performers across asset classes over the past two years, rising from around $2,624/oz at the start of 2025 to an intraday peak of $5,595.75 in late January 2026, before correcting sharply to lows near $4,098 in March. The rally has reflected a combination of sustained central bank buying, a weaker US dollar, geopolitical instability across multiple theatres, and growing concerns about US fiscal deficits and Federal Reserve independence. These same drivers also present a counterargument: a hawkish Fed pivot, rising real yields, or any sustained de-escalation of geopolitical tensions could reduce the safe-haven premium and apply downward pressure on prices, as the March 2026 correction illustrated.
At current levels near $4,785/oz, gold remains broadly above its long-term moving averages but well below January's peak, leaving the near-term picture mixed. Structural demand from central banks and de-dollarisation flows continues to provide a longer-term floor, though the risk of demand destruction at elevated price levels, because higher prices may reduce the volume central banks need to purchase to meet reserve targets, presents a credible headwind.
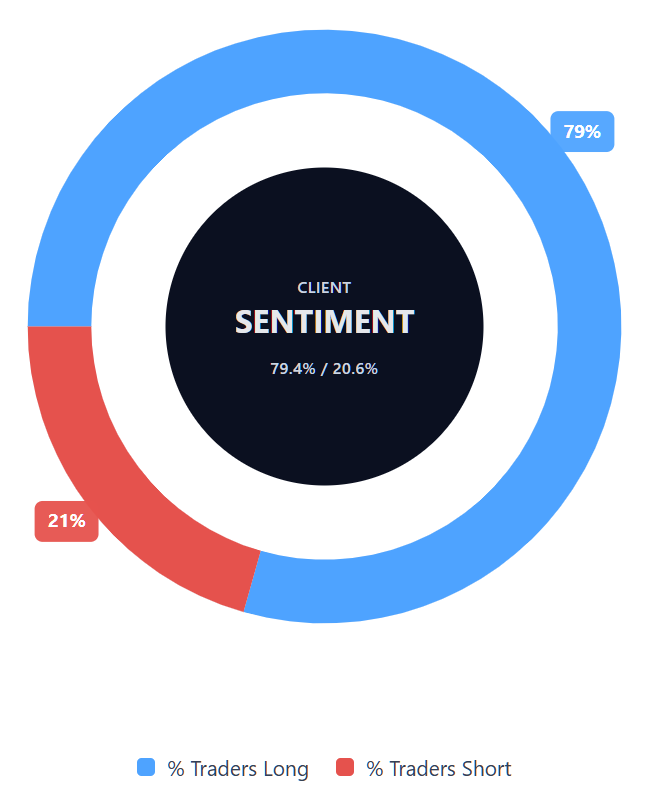
Capital.com’s client sentiment for Gold CFDs
As of 21 April 2026, Capital.com client positioning in Gold spot CFDs stands at 79.4% buyers and 20.6% sellers, which puts buyers ahead by 58.8 percentage points and places sentiment firmly in a heavy-buy, one-sided-towards-longs territory. This snapshot reflects open positions on Capital.com and can change rapidly as market conditions evolve.
Summary – Gold price 2026
- Gold spot (XAU) trades at $4,785.23 as of 11:01am UTC on 21 April 2026, up approximately 82% year on year from $2,624/oz at the start of 2025, and around 14.5% below the January 2026 intraday peak of $5,595.75.
- Key price drivers include sustained central bank buying, a weaker US dollar (DXY near 98.1), Federal Reserve independence concerns, and persistent geopolitical uncertainty. A hawkish Fed pivot or de-escalation could reverse these tailwinds.
- Recent session news focuses on the approaching expiry of the US–Iran ceasefire on 22 April, ongoing Federal Reserve leadership concerns, and the DXY holding near multi-year lows, all of which support near-term haven demand.
Past performance is not a reliable indicator of future results.
FAQ
What is the Gold price forecast?
Could Gold’s price go up or down?
Should I invest in Gold?
Can I trade Gold CFDs on Capital.com?
Yes, you can trade Gold CFDs on Capital.com. Trading commodity CFDs lets you speculate on price movements without owning the underlying asset and to take long or short positions. However, contracts for difference (CFDs) are traded on margin, and leverage amplifies both profits and losses. You should ensure you understand how CFD trading works, assess your risk tolerance, and recognise that losses can occur quickly.