Gold price forecast: US–Israel strikes, oil supply concerns
Gold trades near multi-week highs after U.S.–Israel strikes on Iran, with safe-haven flows, firm oil prices and sizeable futures gaps shaping recent price action in bullion markets. Explore third-party Gold price targets. Past performance is not a reliable indicator of future results.
Gold (XAU/USD) is trading around $5,298.21 in Monday’s US afternoon session, having moved between an intraday low of $5,172.36 and a high of $5,417.54 at 4:35pm (UTC) on 2 March 2026. Past performance is not a reliable indicator of future results.
The latest upswing is unfolding amid escalating Middle East tensions following the U.S.–Israel strikes on Iran, which have supported safe-haven demand and pushed international gold benchmarks to one-month or higher peaks (Reuters, 1 March 2026). Silver has also recorded notable gains (Yahoo Finance, 2 March 2026). Broader market drivers include a mixed performance in the US Dollar Index near the high-90s, elevated crude oil prices linked to supply concerns in the Gulf, and substantial moves in gold futures, including one of the largest close-to-open gaps since late 2025 (Yahoo Finance, 2 March 2026).
Gold price forecast 2026-2030: Analyst price target view
As of 2 March 2026, third-party gold predictions span a wide range, from sub‑$4,500 annual averages to upside scenarios above $6,000 per ounce, reflecting different assumptions about demand, monetary policy and geopolitics. The following summaries highlight a selection of prominent institutional views for the gold market; these are independent forecasts and not guarantees of future performance.
Goldman Sachs (year‑end target upgrade)
Goldman Sachs lifts its year‑end 2026 gold price target to $5,400 per ounce, up from a previous forecast of $4,900, after spot prices hit an all‑time high near $5,589 in late January and then stabilised above $5,000. The bank’s analysts attribute their higher target to a shift in the buyer base, citing net inflows into Western gold ETFs, increased interest from high‑net‑worth investors and family offices in physical bars, and growing use of gold options as a hedge against long‑term fiscal and 'debasement' concerns (Yahoo Finance, 25 February 2026).
J.P. Morgan (bullish scenario and long‑term reset)
J.P. Morgan’s commodities team projects that spot gold could reach around $6,300 per ounce by the end of 2026, implying further gains from current levels, while it also raises its long‑term price estimate to $4,500 per ounce. The bank grounds this outlook in strong and sustained demand from central banks and investors, including higher ETF, bar and coin demand, alongside expectations for a weaker dollar, lower US interest rates and ongoing geopolitical and economic uncertainty (KITCO, 25 February 2026).
ING Think (quarterly path and annual average)
ING Think’s commodity forecasts show gold averaging about $4,900 per ounce in the first quarter of 2026 and rising through $5,100 and $5,300 to around $5,450 in the fourth quarter, with a full‑year 2026 average projected near $5,190. The house links this profile to a combination of resilient investment demand and macro drivers, including real‑yield dynamics and central‑bank activity, while allowing for fluctuations around the quarterly benchmarks (ING Think, 2 March 2026).
Scotiabank (more conservative annual averages)
Scotiabank’s commodities tables indicate a more conservative stance, with gold’s annual average forecast at about $4,100 per ounce in 2026, following $2,386 in 2024 and $3,442 in 2025, before easing slightly to $3,900 in 2027. The bank’s projections suggest that, while prices remain elevated relative to pre‑2020 levels, they may moderate from recent extremes as policy rates, inflation trends and risk appetite evolve (Scotiabank, 2 March 2026).
Predictions and third-party forecasts are inherently uncertain, as they cannot fully account for unexpected market developments. Past performance is not a reliable indicator of future results.
Gold price: Technical overview
On the daily chart (4:35pm UTC, 2 March 2026), Gold’s price holds above a rising moving-average cluster, with the 20-, 50-, 100- and 200-day simple moving averages (SMAs) at approximately 5,048, 4,814, 4,477 and 3,969 respectively, while price trades near $5,298 in the 2 March 2026 US afternoon session. The 20-day remains above the 50-day SMA, and the 10-day SMA and Hull moving average track above $5,100. This alignment keeps the short-term structure constructive provided price remains above the broader moving-average band.
The 14-day relative strength index (RSI) stands near 63.9, placing it in an upper-neutral zone rather than overbought territory. Meanwhile, the average directional index (ADX) at around 18.8 suggests the trend is developing but not yet firmly established.
On the upside, the nearest classic pivot resistance above spot appears near 5,572 (R1). A daily close above this zone would bring the R2 area near 5,866 into focus as the next technical reference point. On pullbacks, the classic pivot near 4,987 marks initial support. Below that, the 100-day SMA around 4,477 forms a deeper support area that helps define the broader uptrend. A sustained move beneath this region could expose the S1 area near 4,694 (TradingView, 2 March 2026).
Technical analysis is provided for informational purposes only and does not constitute investment advice or a recommendation to trade.
Gold price history (2024–2026)
Gold spot prices recorded a pronounced two-year advance, rising from just above $2,100 in March 2024 to trade around $5,289 on 2 March 2026. From mid-2024 into early 2025, the metal largely moved within a $2,100–$2,700 range, before breaking into the low-$3,000s by March 2025.
The pace of gains increased during 2025, with gold moving from roughly $2,870 in early March to around $3,800–$4,000 by the fourth quarter. Pullbacks during this period tended to find support at progressively higher levels. Momentum accelerated at the start of 2026: after opening near $4,332 on 2 January, gold moved above $5,000 by early February and briefly exceeded $5,500 later in the month, before trading back towards $5,289 on 2 March 2026.
Past performance is not a reliable indicator of future results. Share prices are indicative and may differ from live market prices.
Gold price outlook: Capital.com analysis
Gold’s move higher into early 2026 has brought prices to historically elevated levels, with the metal trading near $5,298 on 2 March 2026 after a sustained advance from the low-$3,000s in early 2025. This performance has coincided with periods of safe-haven demand, continued central-bank purchases and phases of US dollar softness. At the same time, rapid repricing episodes highlight how quickly gold can correct when interest-rate expectations or broader risk sentiment shift.
For traders, this environment presents both opportunity and risk. Elevated volatility and wide daily ranges may create short-term trading setups. However, moves against a position can develop quickly and may result in significant losses, particularly when trading leveraged products such as CFDs. A continuation of central-bank demand or renewed dollar weakness could coincide with further support for prices. Conversely, rising real yields, easing geopolitical tensions or profit-taking could weigh on the metal. Market conditions can change rapidly, and gold has historically experienced both extended advances and sharp retracements.
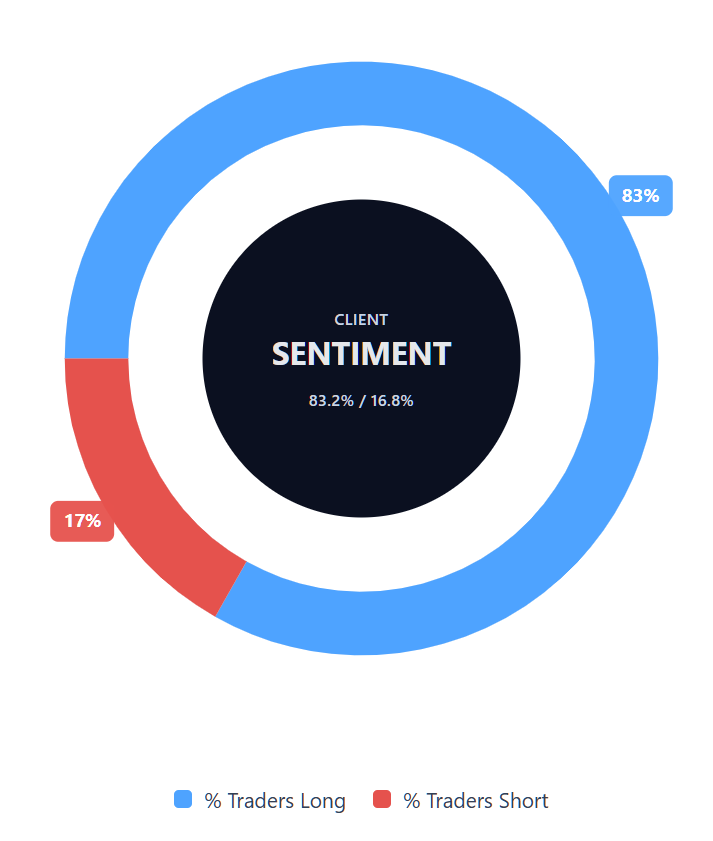
Capital.com’s client sentiment for Gold CFDs
As of 2 March 2026, Capital.com client positioning in Gold spot CFDs shows 83.2% buyers versus 16.8% sellers, resulting in a net long bias of 66.4 percentage points. This distribution indicates that a majority of clients currently hold long positions. Client sentiment reflects open positions on the platform at a given time and can change quickly. It should not be viewed in isolation when assessing market conditions.
Summary – Gold price 2026
- Gold trades near $5,298 on 2 March 2026, after rising from around $2,100 in March 2024.
- The daily structure remains above a rising 20-, 50-, 100- and 200-day moving-average cluster, with RSI in upper-neutral territory and ADX indicating a developing trend.
- Key drivers include safe-haven flows linked to Middle East tensions, central-bank demand and the interaction between real yields, the US dollar and energy prices.
- Third-party analyst targets for 2026 cluster broadly between $4,700 and $5,200 per ounce, with wider scenario ranges on both the upside and downside.
Past performance is not a reliable indicator of future results.
FAQ
What is the gold price forecast?
There is no single gold price forecast. As outlined above, third-party analysts currently project 2026 price targets largely between $4,700 and $5,200 per ounce, with some scenario ranges extending beyond this band. These estimates depend on assumptions about interest rates, central-bank demand, geopolitical developments and US dollar performance. Forecasts reflect opinion at a specific point in time and can change as market conditions evolve.
Could gold’s price go up or down?
Gold’s price can move in either direction, sometimes over short periods. It often reacts to changes in real yields, inflation expectations, currency movements and geopolitical developments. Strong safe-haven demand or sustained central-bank buying may coincide with higher prices, while rising interest rates or reduced risk aversion may weigh on the metal. Volatility can increase during periods of macroeconomic uncertainty, creating both upside and downside risk.
Should I invest in gold?
Whether to invest in gold depends on your financial objectives, risk tolerance and overall portfolio structure. Gold does not generate income, and its price can fluctuate significantly. Some market participants use it for diversification or as a hedge against certain macroeconomic risks, but outcomes are never guaranteed. If you’re considering trading gold through derivatives such as CFDs, remember that leverage increases both potential gains and potential losses.
Can I trade gold CFDs on Capital.com?
Yes, you can trade Gold CFDs on Capital.com. Trading commodity CFDs lets you speculate on price movements without owning the underlying asset and to take long or short positions. However, contracts for difference (CFDs) are traded on margin, and leverage amplifies both profits and losses. You should ensure you understand how CFD trading works, assess your risk tolerance, and recognise that losses can occur quickly.