BlackRock stock forecast: Third-party price targets
BlackRock is a US-listed asset management company on the New York Stock Exchange, overseeing trillions in assets across ETFs, mutual funds and institutional mandates worldwide. Explore third-party BLK price targets and technical analysis.
BlackRock, Inc. (BLK) is trading around $1,072.95 at 3:41pm (UTC) on 11 February 2026, slightly below the session low of $1,074.75 and well under the session high of $1,109.82. Past performance is not a reliable indicator of future results.
Recent price action follows BlackRock’s stronger-than-expected Q4 2025 results in mid-January, when the company reported adjusted earnings per share of $13.16 on quarterly revenue of about $7.0bn, and full-year assets under management (AUM) of roughly $14.0tn, supported by net inflows and market gains (Yahoo Finance, 15 January 2026).
BlackRock stock forecast 2026–2030: Third-party price targets
As of 11 February 2026, third-party BlackRock stock predictions indicate 12-month price targets generally above the current spot level, with most clustered between around $1,250 and the mid-$1,300s. These targets typically reflect assumptions about global equity performance, fund flows and fee trends, and analysts may revise them as new financial or macroeconomic data emerge.
Gurufocus (consensus snapshot)
Gurufocus reports that BlackRock’s average target stands at around $1,286.58, with a high estimate near $1,486 and a low closer to $980. The service noted that this range reflects differing expectations for earnings growth, valuation multiples and macroeconomic conditions as analysts updated their models following the latest results (GuruFocus, 8 January 2026).
BNP Paribas Exane (broker target)
BNP Paribas Exane raises its BLK stock forecast to $1,300 from $1,290, maintaining an ‘outperform’-style rating and implying roughly 12% upside from the reference close cited in the note. The broker links the revision to BlackRock’s Q4 2025 earnings and revenue beat, record AUM near $14tn and capital return plans, while also acknowledging ongoing industry fee pressures (MarketBeat, 15 January 2026).
Barclays (broker target)
Barclays raises its BlackRock price target to $1,467 from $1,431 and maintains an Overweight rating. The higher target reflects Barclays’ assessment of operating performance and earnings capacity, incorporating contributions from newer initiatives and continued demand for BlackRock’s investment products (GuruFocus, 16 January 2026).
CICC Research (broker target)
CICC Research lifts its BlackRock price target from $1,000 to $1,250, indicating potential upside of about 13.5% from the reference trading price in the report, while reiterating a ‘moderate buy’-type stance. The firm cites stronger-than-expected recent results and product developments, including flows into newer strategies, as factors behind the upward revision (MarketBeat, 3 February 2026).
KBW and Jefferies (broker targets)
Keefe, Bruyette & Woods raises its BlackRock target to $1,340 from $1,310, maintaining an Outperform rating. Meanwhile, Jefferies lifts its target to $1,351 from $1,333 following Q4 results that exceeded forecasts. Both brokers point to revenue and earnings outperformance, alongside higher earnings-per-share projections for 2026, as reasons for adjusting their targets (Investing.com, 16 January 2026).
Predictions and third-party forecasts are inherently uncertain, as they cannot fully account for unexpected market developments. Past performance is not a reliable indicator of future results.
BLK stock price: Technical overview
The BLK stock price is trading around $1,072.95 as of 3:41pm UTC on 11 February 2026, with the price holding below a tight moving average cluster. The 20-, 50-, 100- and 200-day simple moving averages sit near 1,107 / 1,091 / 1,100 / 1,076 respectively. The 14-day relative strength index (RSI) at around 45.7 indicates mid-neutral momentum, while an average directional index (ADX) reading near 13.6 suggests a weak or non-trending environment rather than a sustained directional phase.
On the upside, the nearest classic pivot resistance (R1) sits around 1,180, with R2 near 1,241 coming into focus only if the price records a sustained daily close above the first resistance area. On pullbacks, the classic pivot near 1,120 may act as initial support, while the 200-day SMA around 1,076 forms a nearby medium-term reference level. Below that, S1 near 1,059 marks the next lower area to monitor if selling pressure increases (TradingView, 11 February 2026).
This technical analysis is provided for informational purposes only and does not constitute financial advice or a recommendation to buy or sell any instrument.
BlackRock share price history (2024–2026)
BLK’s stock price has moved higher overall over the past two years, with periodic pullbacks as market and interest-rate expectations shifted. In early 2024, the stock traded below $800, closing at $783.05 on 1 July 2024. It then built a base through the summer and autumn in the mid-$800s to low-$900s before moving back above $1,000 and finishing 2024 at $1,029.31 on 31 December.
During 2025, the broader direction remained upward but uneven. BLK dipped below $900 during the April pullback, then recovered into the high-$900s and moved back above $1,000 towards year-end, closing at $1,071.46 on 31 December 2025. So far in 2026, the stock has traded in a wide range above $1,040, with recent prices between approximately $1,055 and $1,120, including $1,076.31 on 11 February 2026.
Past performance is not a reliable indicator of future results. Share prices are indicative and may differ from live market prices.
BlackRock (BLK): Capital.com analyst view
BlackRock’s share price has traded in a higher range over the past two years, reflecting investor responses to earnings performance, record AUM and broader market conditions affecting asset managers. Recent quarterly results showed revenue growth, margin expansion and AUM near $14tn. These factors can support valuations when markets remain stable and client inflows continue. However, earnings and AUM are closely linked to market performance, policy developments and investor risk appetite, which may also weigh on valuations if conditions weaken.
Looking ahead, potential drivers for BlackRock include industry trends such as demand for ETFs, interest in alternative strategies and the overall outlook for global asset management. Some analysts highlight steady AUM growth as supportive, while also pointing to structural fee pressure and rising operating costs as ongoing challenges. New products and strategic initiatives may attract additional flows in favourable market conditions, but they also introduce execution and regulatory risks. In addition, broad market corrections or prolonged volatility could affect fee income and sector valuations.
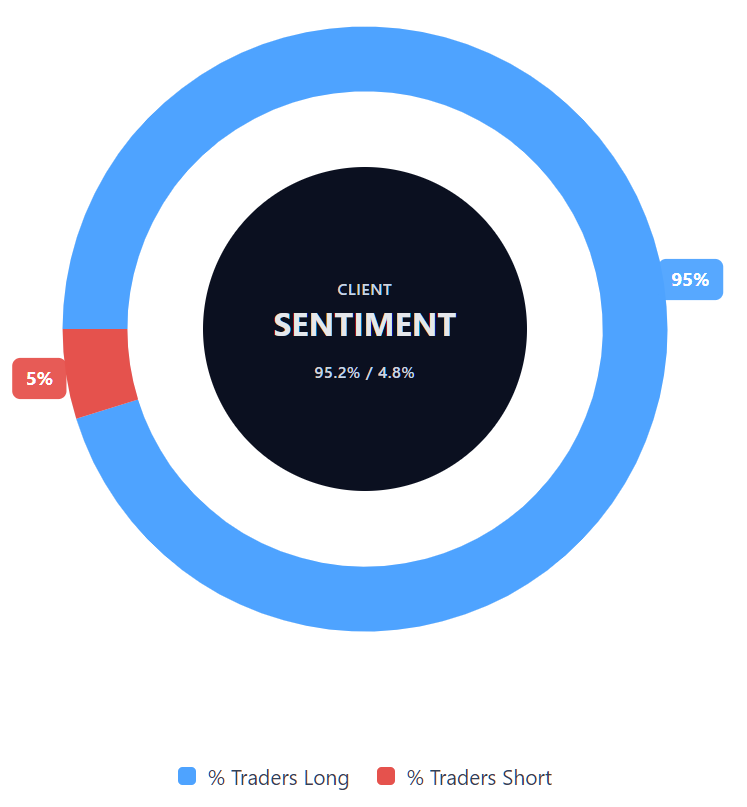
Capital.com’s client sentiment for BlackRock CFDs
As of 11 February 2026, Capital.com client positioning in BlackRock CFDs is currently skewed towards long positions, with buyers at 95.2% and sellers at 4.8%, placing buyers ahead by around 90 percentage points. This distribution reflects a pronounced long bias rather than a balanced positioning profile. This data represents open positions on Capital.com at the time of writing and may change.
Summary – BlackRock 2026
- BlackRock trades around $1,070-$1,100 in early 2026 following a choppy but broadly upward two-year move from levels below $800 in 2024.
- Technical indicators show the price below a cluster of key moving averages, with a mid-neutral RSI and a low ADX reading, consistent with limited directional strength.
- Key fundamental themes cited by analysts include record AUM near $14tn, recent revenue and margin trends, and the wider asset management outlook, which combines growth opportunities with risks linked to fees and market volatility.
Past performance is not a reliable indicator of future results.
FAQ
Who owns the most BlackRock stock?
BlackRock is a publicly listed company, so its shares are held by a mix of institutional investors, asset managers and individual shareholders. Large global institutions, including asset managers and index fund providers, often rank among the largest holders through passive and active investment funds. Ownership levels can change over time as funds rebalance portfolios or respond to client inflows and outflows, so the identity and size of the largest shareholder can vary between reporting periods.
What is the 5-year BlackRock share price forecast?
There is no single agreed five-year BLK stock forecast. Most publicly available analyst estimates focus on 12-month price targets rather than longer time frames. Over a five-year horizon, projections would depend on factors such as global equity performance, assets under management, fee trends, regulatory developments and broader economic conditions. Long-term forecasts involve a high degree of uncertainty and may shift materially as new company data and macroeconomic information become available.
Is BlackRock a good stock to buy?
Whether BlackRock is considered a ‘good’ stock depends on an individual’s objectives, risk tolerance and investment horizon. Analysts typically review measures such as earnings growth, assets under management, operating margins and valuation multiples when forming their assessments. However, BlackRock’s financial performance is closely linked to global market conditions and investor flows, which can fluctuate. Any decision to buy shares should weigh potential returns against the risk of capital loss and market volatility.
Could BlackRock stock go up or down?
BlackRock’s share price can move in either direction, sometimes over short periods. It may respond to company-specific developments such as earnings releases and fund flow data, as well as broader influences including interest rate changes, equity market trends and sentiment towards financial stocks. Technical levels and market positioning can also influence shorter-term price movements. As with any listed company, future price movements are uncertain and may involve periods of heightened volatility.
Should I invest in BlackRock stock?
Deciding whether to invest in BlackRock stock requires careful consideration of your financial circumstances, investment goals and tolerance for risk. Direct share ownership exposes investors to market fluctuations and company-specific developments. It is important to consider how such an investment would fit within a diversified portfolio and to understand the possibility of losses as well as gains. This information is provided for general educational purposes only and does not constitute investment advice or a recommendation.
Can I trade BlackRock CFDs on Capital.com?
Yes, you can trade BlackRock CFDs on Capital.com. Trading share CFDs lets you speculate on price movements without owning the underlying asset and to take long or short positions. However, contracts for difference (CFDs) are traded on margin, and leverage amplifies both profits and losses. You should ensure you understand how CFD trading works, assess your risk tolerance, and recognise that losses can occur quickly.