SAP SE stock forecast: Q4 cloud backlog miss
SAP SE is a German enterprise software company listed on Xetra; its shares fell after 29 January 2026 Q4 2025 results showed 25% cloud backlog growth, below guidance. Past performance is not a reliable indicator of future results. Explore third-party SAP price targets and technical analysis.
SAP SE (SAP) is trading at €165.65 as of 2.19pm UTC on 11 March 2026, within an intraday range of €164.55–€172.15 on Capital.com's quote feed. Past performance is not a reliable indicator of future results.
Pressure on SAP continues to reflect the aftermath of its Q4 2025 earnings report on 29 January 2026, in which cloud backlog growth of 25% at constant currencies came in slightly below management's indicated threshold. Reuters reported that shares fell as much as 17% in that single session (Reuters, 29 January 2026). The broader European equity environment added context, with the Euro STOXX 50 falling 1.35% to 5,762 points on 11 March 2026 and the STOXX 600 navigating a mixed session as investors weighed AI infrastructure demand (Saxo Bank, 11 March 2026).
SAP SE stock forecast 2026–2030: Third-party price targets
As of 11 March 2026, third-party SAP SE stock predictions reflect a broad recalibration since the company's Q4 2025 data, released in January 2026. Most broker revisions cluster in a $245–$305 range on the NYSE-listed ADR, amid ongoing debate over AI disruption risk to enterprise software incumbents.
Zacks Research (downgraded to Hold)
Zacks Research cut SAP from Strong Buy to Hold, pulling back from its prior constructive stance as the stock failed to recover materially from its January lows. The revision reflects Zacks' reassessment of near-term momentum, with SAP's 50-day moving average sitting at $218.45 against a 200-day moving average of $244.86, signalling continued weakness in the technical trend (MarketBeat, 7 March 2026).
Barclays, BMO Capital (broker targets)
Insider Monkey reports that Barclays, which carried an Overweight rating, lowered its price target on SAP to $283 from $348 on 2 February 2026, noting the post-earnings share price reaction appeared large relative to underlying fundamentals. BMO Capital also trimmed its Outperform target to $245 from $320 on 30 January 2026, citing the Q4 cloud backlog miss. Both firms kept positive ratings intact, indicating continued confidence in SAP's longer-term cloud trajectory even as near-term growth assumptions were revised lower (Yahoo Finance, 4 March 2026).
MarketBeat (consensus overview)
MarketBeat aggregates 20 analyst ratings, showing a Moderate Buy consensus with an average 12-month price target of $305.75. The breakdown comprises 2 Strong Buy, 12 Buy, and 6 Hold ratings. The consensus target implies potential upside from the stock's recent trading range near $202, with the 52-week price range spanning $187.93–$313.28 as SAP's post-earnings de-rating widened the gap between Street targets and prevailing market prices (MarketBeat, 7 March 2026).
Public.com (analyst aggregate)
Public.com reports an aggregate analyst price target of $340.75 for SAP SE, derived from multiple 12-month broker estimates. The figure sits at the higher end of the visible target range and may include estimates that have not yet been fully revised following the January earnings reset, as analysts with longer modelling horizons maintain a more constructive view on SAP's AI-augmented ERP roadmap (Public.com, 9 March 2026).
Predictions and third-party forecasts are inherently uncertain, as they cannot fully account for unexpected market developments. Past performance is not a reliable indicator of future results.
SAP stock price: Technical overview
The SAP stock price trades at €165.65 as of 2.19pm UTC on 11 March 2026, sitting well below a steeply descending moving average stack. The 20/50/100/200-day SMAs slope down at approximately €200 / €217 / €234 / €259, with each shorter-term average trading below the next longer-term one. This sequential alignment signals a persistent downtrend and highlights the depth of the drawdown from 2025 highs.
The 14-day relative strength index (RSI) reads 38.48, sitting in the lower-neutral zone and pointing to persistent selling pressure without yet reaching oversold territory. The average directional index (ADX) at 28.55 indicates an established trend and suggests the directional move has sufficient strength to remain relevant in trend assessment.
On any recovery attempt, the classic pivot (P) at €201.24 represents the first meaningful overhead reference. A daily close back above that level would put the R1 pivot at €213.27 in view. Beyond there, the 10-day SMA near €199 and 20-day SMA near €200 form a nearby resistance shelf that price would need to reclaim to shift the short-term tone.
On the downside, initial support is found at the S1 pivot at €189.51. A loss of that level on a closing basis would bring the S2 area at €177.48 into focus. The wide gap between current price and the long-term moving average stack suggests the 100-day SMA at €234 remains a distant overhead barrier unless a sustained recovery develops (TradingView, 11 March 2026).
This is technical analysis for informational purposes only and does not constitute financial advice or a recommendation to buy or sell any instrument.
SAP SE share price history (2024–2026)
SAP’s stock price traded in a relatively tight band through spring and summer 2024, moving from around €172 in March to a high of €199.50 in early September, before pulling back briefly to €181.40 on 5 August amid a broader European equity sell-off. A sustained recovery from that low carried SAP through the €200 level in September 2024 and into the €210–€242 range by year-end, closing 2024 at €236.50.
Momentum accelerated into early 2025. SAP climbed from €238.60 on 2 January 2025 to its record €283.80 intraday high on 19 February, alongside strong cloud growth expectations. The stock then reversed course, sliding to €238.85 by 11 March 2025 before partially recovering into the €265–€272 range through June and July 2025. A second leg lower began in late July, with SAP falling from €266.10 on 17 July to €179.70 intraday on 29 January 2026, the session following Q4 2025 earnings, which disappointed on cloud backlog growth.
SAP closed at €166 on 11 March 2026, approximately 29.8% below its 11 March 2025 close of €238.85, and around 41.5% below its all-time high of €283.80 set on 19 February 2025.
Past performance is not a reliable indicator of future results. Share prices are indicative and may differ from live market prices.
SAP SE (SAP): Capital.com analyst view
SAP SE's share price has undergone a significant reset since its all-time high of €283.80 in February 2025, reflecting a market reassessment of the company's near-term cloud growth trajectory following its Q4 2025 results. The quarter's current cloud backlog (CCB) growth of 25% at constant currencies came in marginally below analyst expectations, and SAP's 2026 cloud revenue guidance of €25.8–€26.2 billion disappointed a market that had priced in faster acceleration. At the same time, SAP's cloud ERP suite revenue grew 32% in full-year 2025 and predictable subscription revenues now represent 86% of total revenue, a structural shift that some analysts argue could support earnings stability, even if headline growth rates moderate.
The medium-term debate centres on whether AI integration acts as a tailwind or a disruptive threat. SAP CEO Christian Klein has positioned SAP Business AI, embedded in two-thirds of Q4 cloud order entries, as a core growth lever, and the autonomous enterprise software market is projected to grow from approximately $49 billion in 2024 to over $118 billion by 2030. However, HSBC has cautioned that around 60% of SAP's on-premises customer base has yet to begin migrating to the cloud, and rising competition may cause further delays, which could pressure near-term backlog growth.
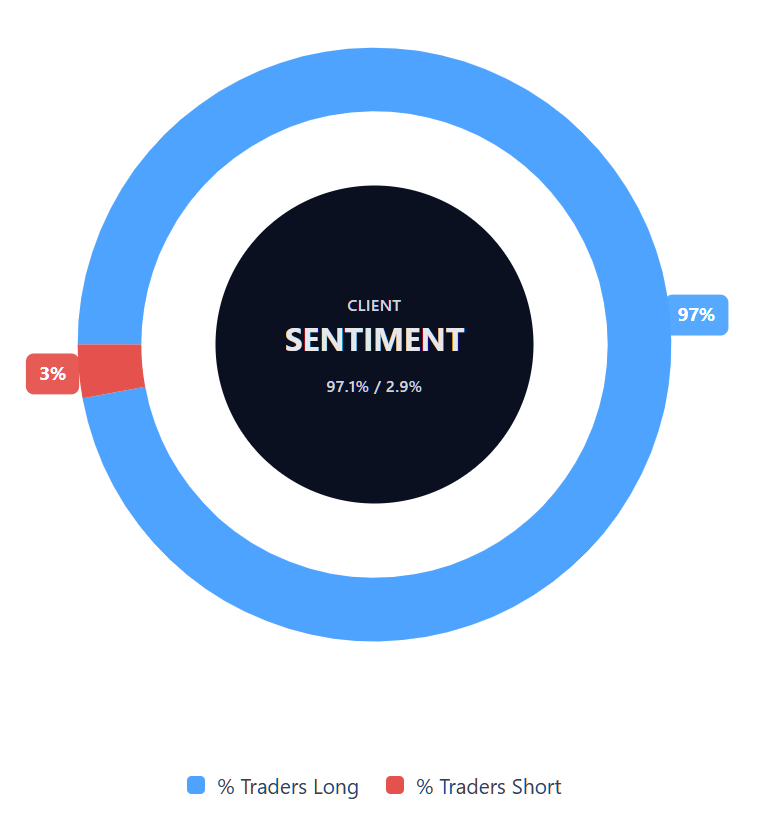
Capital.com’s client sentiment for SAP SE CFDs
As of 11 March 2026, Capital.com client positioning in SAP SE CFDs is skewed toward buyers: 97.1% long vs 2.9% short, putting buyers ahead by 94.2 percentage points and placing sentiment in one-sided territory toward longs. This snapshot reflects open positions on Capital.com at the time of capture and can change rapidly as market conditions evolve.
Summary – SAP SE 2026
- SAP trades at €165.65 as of 2.19pm UTC on 11 March 2026, down approximately 41.5% from its all-time high of €283.80 set on 19 February 2025.
- Technical indicators are bearish: price sits well below a descending 20/50/100/200-day SMA stack, with the 14-day RSI at 38.48 and the ADX at 28.55 confirming an established downtrend.
- Key drivers include SAP's Q4 2025 cloud backlog growth miss, disappointing 2026 cloud revenue guidance, and broader market debate over AI disruption risk to enterprise software incumbents.
Past performance is not a reliable indicator of future results.
FAQ
Who owns the most SAP SE stock?
What is the 5 year SAP SE share price forecast?
Is SAP SE a good stock to buy?
Could SAP SE stock go up or down?
Should I invest in SAP SE stock?
Can I trade SAP SE CFDs on Capital.com?
Yes, you can trade SAP SE CFDs on Capital.com. Trading share CFDs lets you speculate on price movements without owning the underlying asset and to take long or short positions. However, contracts for difference (CFDs) are traded on margin, and leverage amplifies both profits and losses. You should ensure you understand how CFD trading works, assess your risk tolerance, and recognise that losses can occur quickly.