BASF stock forecast: Third-party price targets
BASF SE is a Germany-based chemical producer listed in Frankfurt, supplying industrial chemicals, materials and agricultural products to customers across Europe, Asia and the Americas. Explore third-party BAS price targets and technical analysis.
BASF SE (BAS) is trading around €49.59 in intraday European dealings at 3:09pm UTC on 18 February 2026, moving within a session range of approximately €49.17–€51.18, amid strong net long positioning on the platform. Past performance is not a reliable indicator of future results.
The stock is trading after BASF released preliminary full-year 2025 figures on 22 January 2026, reporting expected sales of about €59.7bn, EBITDA before special items of €6.6bn, free cash flow of €1.3bn and projected net income of €1.6bn, all compared with 2024 levels (BASF, 22 January 2026). Trading also comes amid broader pressure on Europe’s chemical industry. Sector studies refer to plant closures and reduced investment capacity across the region, alongside ongoing debate over energy costs, regulation and competitiveness, which continue to influence investor focus on German industrial bellwethers (CHEManager, 5 February 2026).
BASF stock forecast 2026–2030: Third-party price targets
As of 18 February 2026, third-party BASF stock predictions indicate a relatively concentrated range over a 12-month horizon. The summaries below outline selected third-party targets, highlighting their stated levels, timeframes and key assumptions as of their respective publication dates.
MarketScreener (consensus data)
MarketScreener’s BAS stock forecast page records an average target price of about €49.64, based on estimates that range between €36 and €62. The service attributes the consensus to multiple covering analysts, with the difference between price and target reflecting varied views on valuation following the recent share price recovery (MarketScreener, 16 February 2026).
Berenberg (broker update)
Berenberg raises its BASF target price from €38 to €48 per share and upgrades the stock from ‘sell’ to ‘hold’. The broker states that the higher target reflects a reassessment of earnings-momentum risks amid potential EU policy support for energy-intensive industries, as well as an updated valuation view following the stock’s re-rating (MarketScreener, 17 February 2026).
Simply Wall St (narrative review)
A Simply Wall St analysis discusses the evolving narrative around BASF and cites consensus estimates and valuation metrics suggesting that analyst targets sit moderately above certain discounted cash-flow-based fair value estimates. The article notes that these targets follow revised expectations after BASF’s preliminary 2025 figures, with analysts weighing guided EBIT of about €1.6bn against improved net income and ongoing cost and portfolio measures (Simply Wall St, 9 February 2026).
Berenberg (broker revision)
Berenberg’s update reiterates a €48 target and highlights a shift from its October 2025 bearish stance, which had focused on oversupply and earnings-momentum concerns. The revised view reflects changing political signals toward the European chemicals industry. Berenberg also cites its updated 2026 adjusted EPS estimate of €2.66 and expected FY26 EBITDA guidance of around €6.7bn–€7.2bn as inputs underpinning the revised target, alongside discussion of potential EU support measures (Investing.com, 17 February 2026).
Predictions and third-party forecasts are inherently uncertain, as they cannot fully account for unexpected market developments. Past performance is not a reliable indicator of future results.
BAS stock price: Technical overview
The BAS stock price is trading around €49.59 as of 3:09pm UTC on 18 February 2026, holding above a rising cluster of moving averages. The 20-, 50-, 100- and 200-day simple moving averages (SMAs) sit near €48, €46, €45 and €44 respectively. The 20-day remains above the 50-day, indicating continued short-term strength relative to the medium-term trend. The 14-day RSI, at around 57.8, sits in the upper-neutral zone, while the ADX near 35.8 suggests an established trend rather than a range-bound environment.
On the topside, traders may monitor the classic R1 pivot at €47.34, with R2 at €48.71 potentially coming into focus on a sustained daily close above nearby resistance. On pullbacks, initial support appears near the classic pivot around €45.33. The 100-day SMA, near €44.63, marks a further technical reference point. A decisive break below this moving-average zone could open the way toward the S1 area around €43.96 (TradingView, 18 February 2026).
This technical analysis is for informational purposes only and does not constitute financial advice or a recommendation to buy or sell any instrument.
BASF share price history (2024–2026)
Over the past two years, the BAS stock price has traded within a relatively contained but active range, moving between the low-€40s and mid-€50s as sentiment toward European chemicals has shifted. The stock dipped toward approximately €41–€42 on several occasions through mid-2024, before recovering into the €44–€47 area later that year and advancing into the upper-€40s and low-€50s in early 2025.
After rising to the mid-€50s in March 2025, BASF spent much of the remainder of the year oscillating around the mid-€40s. Pullbacks toward roughly €42–€43 were followed by rebounds toward €45–€47. In early 2026, the tone has been firmer: the share price climbed from around €44–€45 at the start of January to close at €49.68 on 18 February 2026, leaving it near the upper end of its recent trading range.
Past performance is not a reliable indicator of future results. Share prices are indicative and may differ from live market prices.
BASF (BAS): Capital.com analyst view
Over the past two years, BASF’s share price has reflected shifting expectations around European industrial activity, energy costs and corporate earnings. The stock has moved between the low-€40s and mid-€50s, with the latest advance from around €44–€45 at the start of 2026 to just under €50 by 18 February suggesting a renewed willingness among market participants to price in stabilisation scenarios for diversified chemical groups.
At the same time, the relatively narrow long-term range and repeated reversals indicate that sentiment remains sensitive to macroeconomic data, input costs and regulatory developments. From one perspective, BASF’s diversified operations, cost measures and gradual recovery from prior lows may support stability if industrial demand and policy conditions improve. Alternatively, continued uncertainty around European growth, energy pricing and regulation could limit upside or contribute to renewed volatility, particularly if earnings or cash flow diverge from market expectations.
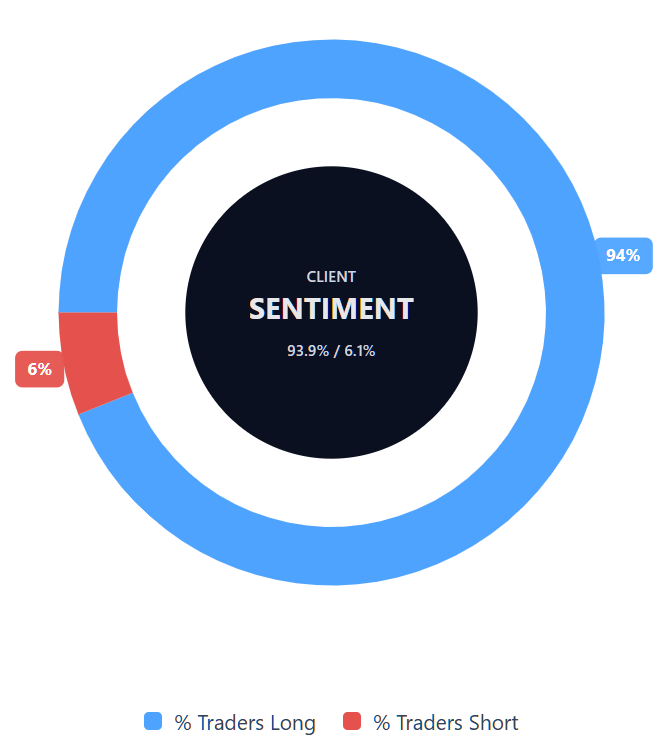
Capital.com’s client sentiment for BASF CFDs
As of 18 February 2026, Capital.com client positioning in BASF CFDs is currently skewed toward buyers, with 93.9% of accounts holding long positions and 6.1% holding short positions, a difference of approximately 87.9 percentage points. This snapshot reflects open positions on the platform at the time of writing and can change as market conditions evolve.
Summary – BASF 2026
- BASF’s share price traded largely in the low- to mid-€40s during 2024, before oscillating between the low-€40s and mid-€50s through 2025.
- In early 2026, the price moved from around €44–€45 in January to close at €49.68 on 18 February, placing it near the upper boundary of its recent range.
- Over the past two years, price movements have coincided with changing sentiment toward European chemicals, fluctuating energy costs and broader macroeconomic developments.
- In technical analysis terms, the stock currently trades above a rising cluster of medium- and long-term moving averages, while momentum indicators remain positive but below overbought territory as of 3:09pm on 18 February 2026.
Past performance is not a reliable indicator of future results.
FAQ
Who owns the most BASF stock?
What is the 5-year BASF share price forecast?
There is no single, universally agreed five-year BAS stock forecast. Most published analyst targets focus on a 12-month horizon, with recent estimates clustering in the high-€40s and ranging from the mid-€30s to the low-€60s. Longer-term projections depend on assumptions about European industrial demand, energy costs, regulation and BASF’s earnings trajectory. Such forecasts are inherently uncertain and may be revised as economic conditions and company-specific factors evolve.
Is BASF a good stock to buy?
Whether BASF is considered a ‘good’ stock depends on an individual’s objectives, time horizon and risk tolerance. The company operates a diversified chemicals business and has recently reported preliminary financial results that point to changes in key financial metrics. At the same time, it faces sector-wide pressures, including energy costs and cyclical demand. Market participants typically assess fundamentals, valuation, industry trends and broader macroeconomic conditions before making any investment decision.
Could BASF stock go up or down?
Like any listed equity, BASF’s share price can move in either direction. Recent technical indicators show the stock trading above several key moving averages, while analyst targets span a relatively wide range. Future price movements may reflect shifts in earnings expectations, policy developments, energy prices, global growth trends and overall market sentiment. Share prices can be volatile, and past performance is not a reliable indicator of future returns.
Should I invest in BASF stock?
Yes, you can trade BASF CFDs on Capital.com. Trading share CFDs lets you speculate on price movements without owning the underlying asset and to take long or short positions. However, contracts for difference (CFDs) are traded on margin, and leverage amplifies both profits and losses. You should ensure you understand how CFD trading works, assess your risk tolerance, and recognise that losses can occur quickly.