Trading the S&P 500 Amidst Fresh Negative Factors
Technicals weaken in the shorter-term time frame, while in sentiment CoT speculators are finally net short all four U.S. equity indices.
U.S. equity index futures are in significant retreat following a difficult week for risk assets as geopolitical tensions boosted oil prices raising downside growth risks and upside inflation ones. That, combined with disappointing labor data and ongoing concerns in private credit meant additional significant red factors.
The sea of red this morning is having an even larger impact in Asia with Japan’s Nikkei 225 (-6%) plunging. That’s because oil prices (WTI) gapped higher again as the U.S.–Iran war disrupts shipping through the Strait of Hormuz, forcing Gulf producers into curbing output while tankers halt transit and storage fills, and where President Trump sees short-term oil prices as “a very small price to pay”. Treasury yields ended Friday lower but not on the further end of the curve as it steepened, though futures are showing a gap higher across the curve on inflationary fears. This morning’s moves have also shown a flight to liquidity boosting the greenback.
Shares of Nvidia (-3%) fell back notably in what was a clear red session for semiconductors with larger losses for AMD (-3.5%) and Intel (-5.5%), the notable exception Marvell Technology (+18.4%) after its strong quarterly results. Most defense stocks finished higher as President Trump who wants to boost the defense budget by 50% said the largest defense manufacturing companies agreed to quadruple production of “Exquisite Class” weaponry. Energy stocks naturally closed higher alongside surging crude prices, including Shell (+2.1%), BP (+2.9%), and Occidental Petroleum (+1.8%), though travel and transport stocks fell sharply as the spike in oil prices threatened margins, and so too trucking companies due to rising diesel costs.
Economic data largely disappointed, as Non-Farm Payrolls in February posted a sharp downside surprise losing 92K jobs (vs expectations of 58K gains) with prior months revised lower as well. The unemployment rate ticked up to 4.4%, and average hourly earnings rose 0.4% m/m (month-on-month) with both slightly higher than anticipated, while the U6 underemployment rate dropped a couple notches to 7.9%. Retail sales for the same month showed 0.2% m/m decline for its headline while its core was flat, and January consumer credit growth slowed notably to $8.0bn.
We did hear from several FOMC (Federal Open Market Committee) members recently, Waller that energy shocks could create complications for policy if prices unwind quickly but that the war is unlikely to cause sustained inflation, Daly that the weak February jobs report complicates policy decisions as inflation remains above the 2% target, Miran that he may dissent if rates are not cut, Schmid that businesses are pausing hiring partly due to artificial intelligence and demographic shifts, Collins that policy should remain mildly restrictive for now with no urgency for further adjustments until clearer evidence of inflation moving toward target, Hammack that policy should remain on hold for now given inflation risks that could keep price growth near 3% this year, and Bowman still supporting 75bp (basis point) cuts this year.
Week ahead
It’s mostly low-impacting items out of the U.S. today with the attention on the conflict and its impact on oil prices, but we’ll get CPI (Consumer Price Index) on Wednesday, the weekly unemployment claims on Thursday, and a data dump on Friday including PCE (Personal Consumption Expenditures), preliminary GDP (Gross Domestic Product), and the preliminary consumer sentiment and inflation expectation figures out of UoM (University of Michigan). In earnings, there’s Oracle’s figures tomorrow and Adobe’s on Thursday.
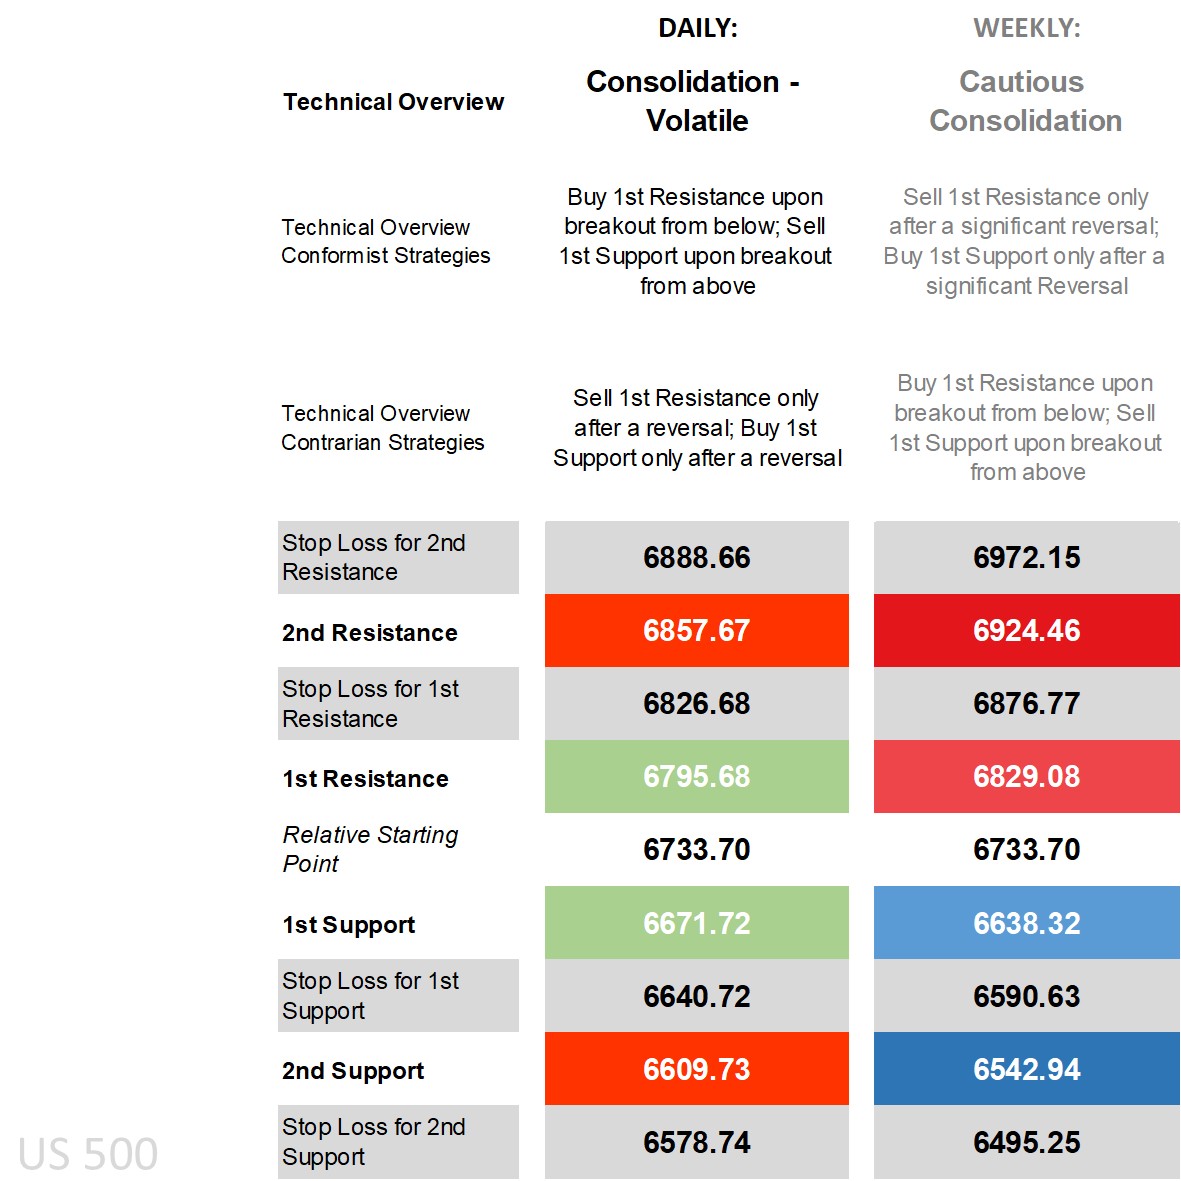
S&P 500’s technical overview, strategies and levels
Looking at the daily time frame and price is now below all its main moving averages (MA), on the DMI (Directional Movement Index) front the -DI extending its lead over the +DI and overall negative, an RSI (Relative Strength Index) not that far off oversold territory, and an ADX (Average Directional Movement Index) reading that’s rising and by one calculation in trending territory. There’s no denying the negative technical bias in the shorter-term time frame, and while it’s tempting to immediately label it as ‘bearish’ a quick glance at the rangebound movement prior over the past few months has caused the technicals to huddle and in turn any break from the average makes it look as though technicals have shifted. In all the overview is more ‘consolidation – volatile’ impacted by headlines but where absent that 2nd levels have a much better chance at holding on average. Conformist strategies are for breakouts off the 1st levels while going opposite off the 2nd levels ideally after a reversal depending on how strong the fundamental update is. Contrarian strategies are for reversals off daily 1st levels as fading strategies are far more prone to getting stopped out.
Zooming out to the weekly and the overview has turned more cautious from a previous ‘bull average’ as the market stalled near the highs and repeatedly failed to offer upside momentum. Conformist strategies on the longer-term time frame are for 1st levels holding only after a significant reversal if price recovers to for example, the weekly 1st Support level before initiating, while contrarians that see a big move from the average have breakout strategies that they can use.
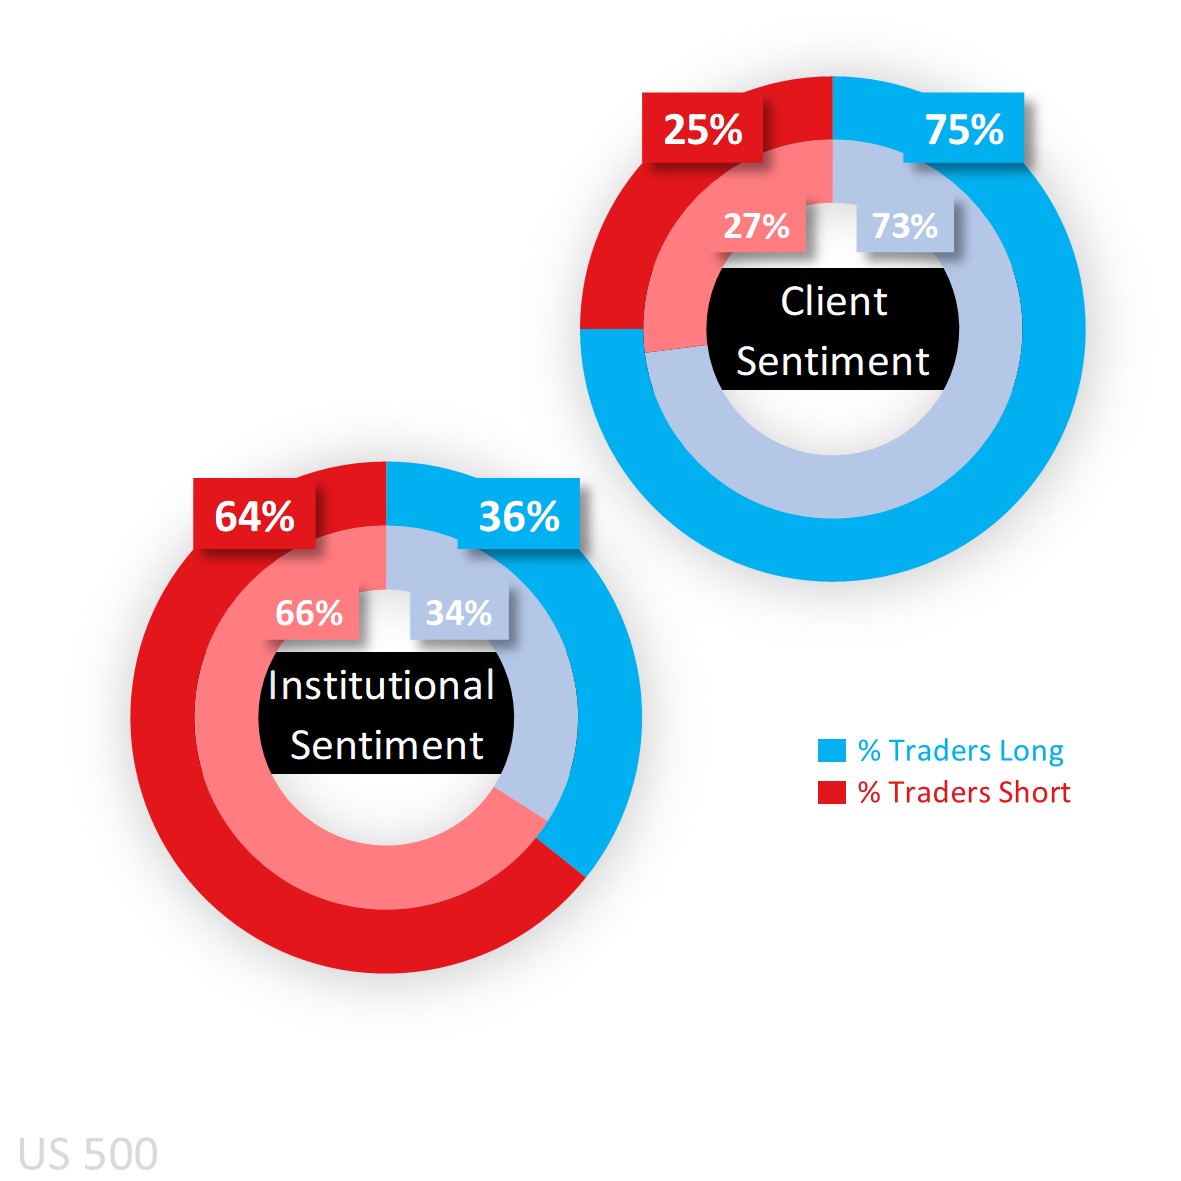
Capital.com’s client sentiment for S&P 500
Long bias has risen in the S&P 500 at the start of this week when looking at Capital.com’s clients, and not too far off extreme buy territory. Fresh longs are still getting squeezed but the pullback if being relatively contained may see more buy positions hold anticipating a recovery.
As for the latest CoT (Commitment of Traders) report, larger speculators reduced their net short bias by a couple notches in the S&P 500 (to 64% from 66%) on an increase in longs (by 6,655 lots) and a simultaneous reduction in shorts (15,505), but it’s interesting to note that they shifted to net short in the Nasdaq 100 and Dow 30, and alongside the Russell 2000 are now net short all four equity indices.
Client sentiment mapped on the daily chart
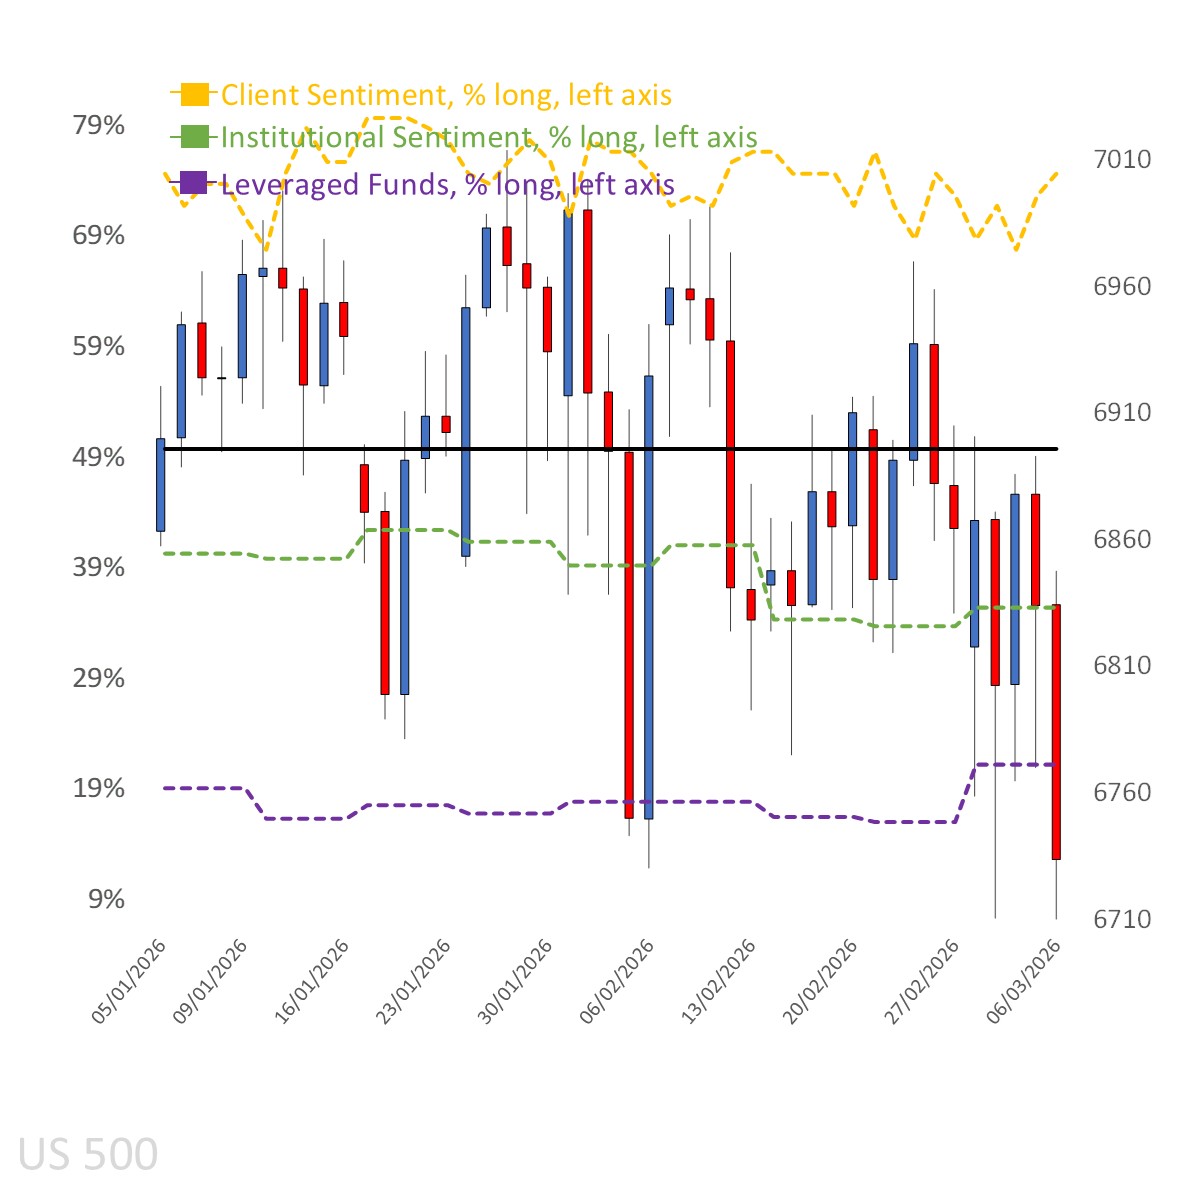
Source: Capital.com
Period: January 2026 – March 2026
Past performance is not an indicator of future results.
S&P 500’s chart on Capital.com’s platform with key technical indicators
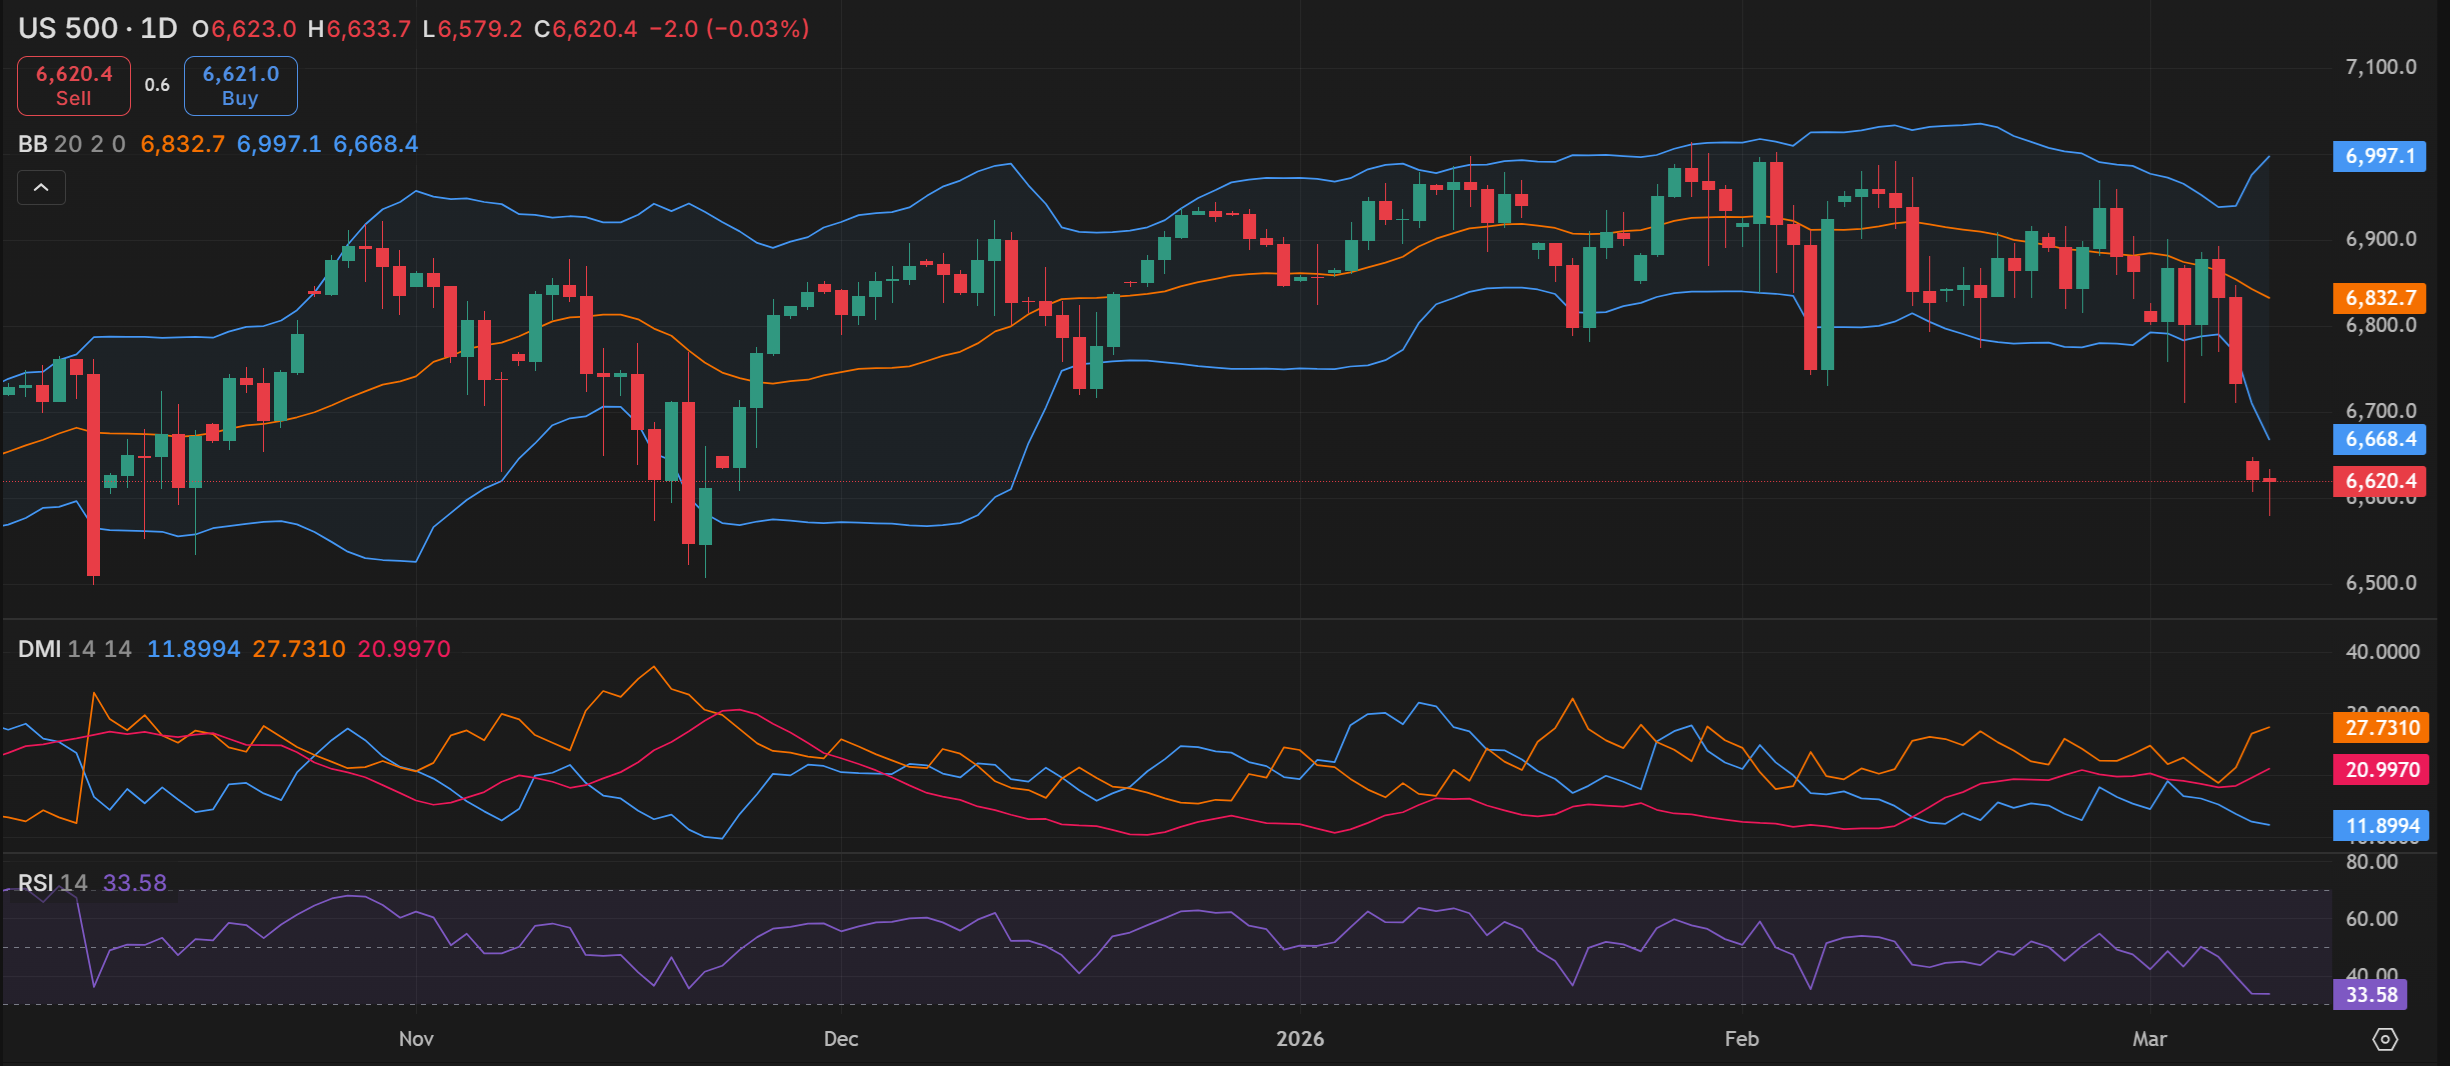
Source: Capital.com
Period: October 2025 – March 2026
Past performance is not an indicator of future results.