Dow Jones index forecast: Iran tensions ease, tech gains
Dow Jones Industrial Average traded at $46,740.0 on 1 April 2026, after recovering from the April 2025 tariff-driven low, with price action shaped by trade policy, Fed expectations, and recent US data.
Past performance is not a reliable indicator of future results. Explore third-party US30 targets and technical analysis.
The Dow Jones Industrial Average index – referred to as the US Wall Street 30 (US30) on CFD trading platforms such as Capital.com – is trading at $46,740.0 as of 4:07pm UTC on 1 April 2026, within an intraday range of $45,112.3 to $46,756.7. Past performance is not a reliable indicator of future results.
US 10-year Treasury yields eased to around 4.3% from a recent high of 4.48%, reflecting renewed rate-cut expectations for 2026 (Trading Economics, 1 April 2026). US job openings also fell by 358,000 to 6.88 million in February 2026, below expectations, adding to the case for a softer labour market and looser monetary conditions (US Bureau of Labor Statistics, 31 March 2026). Technology and semiconductor stocks led gains on 31 March, with Nvidia rising 5.6% and Marvell advancing 12.8% after a strategic investment announcement, which also supported the index (Yahoo Finance, 31 March 2026).
US Wall Street 30 forecast 2026–2030: Third-party targets
As of 1 April 2026, third-party US Wall Street 30 predictions reflect a broad range of outlooks, with methodologies spanning technical analysis, algorithmic modelling, and price-cycle extrapolation. The following targets, all sourced between 20 March and 1 April 2026, illustrate the divergence in near-term and year-end projections.
Long Forecast (monthly model)
Long Forecast projects the DJIA to close April 2026 at 41,318, within a monthly range of $38,412 to $48,000, and to end 2026 at 47,000 after traversing a mid-year trough in May to August in the $38,494 to $45,856 band. The model implies a year-to-date change of -4.0% by December 2026, with a partial recovery in Q4, as the price-cycle algorithm extrapolates bearish momentum from March's -7.6% monthly close (Long Forecast, 30 March 2026).
LiteFinance (technical analysis, 12-month table)
LiteFinance sets an April 2026 range of $45,800 to $49,200, rising to a December 2026 range of $49,500 to $55,500, with key support at $46,020 to $46,236 and resistance at $50,034, $52,022, and $55,003. The analysis notes the RSI at 68 and MACD in positive territory, flagging a possible near-term pullback while maintaining a medium-term upward bias, with the EMA 6, SMA 12, and SMA 24 all acting as support (LiteFinance, 31 March 2026).
CoinPriceForecast (long-range algorithmic model)
CoinPriceForecast places the DJIA at 54,082 by mid-2026 and 54,651 at year-end 2026, implying a gain of approximately +9% from its reference level of 50,116. The forecast is updated daily using a trend-extrapolation model based on historical price cycles. The site's most recent short-term series projected April 2026 at 51,959, rising to June 2026 at 53,663, with the model assuming no macro disruption to the prevailing upward gradient (CoinPriceForecast, 1 April 2026).
Predictions and third-party forecasts are inherently uncertain, as they cannot fully account for unexpected market developments. Past performance is not a reliable indicator of future results.
US30 index price: Technical overview
The US30 index trades at $46,740.0 as of 4:07pm UTC on 1 April 2026, sitting just above the classic pivot at 46,821 and broadly within the intraday range of $45,112.3 to $46,756.7, per the Capital.com quote feed.
The moving-average picture is mixed. The short-term 10/- and 20-day SMAs at around 45,979 and 46,576 are signalling buys, and the 200-day SMA at around 46,698 sits close to the current price, also aligned with a buy signal. The 30/-, 50/- and 100-day SMAs at around 47,421, 48,227, and 48,113, however, all sit above the last price and register sell signals, indicating that the index trades in a compressed zone between near-term support and medium-term overhead, according to TradingView data. The Hull moving average (9) at around 45,886 points to a buy signal, while the Ichimoku base line at around 47,436 reads neutral. The 14-day RSI at 47.70 is neutral, while the average directional index at 34.64 indicates that an established trend is in force.
On the topside, the R1 classic pivot at 48,585 represents the nearest reference above; a daily close through that area would bring R2 near 50,829 into view. On pullbacks, the classic pivot at 46,821 provides an initial reference point, with the 200-day SMA shelf around 46,698 the next level below; losing that shelf would bring S1 at 44,578 into view (TradingView, 1 April 2026).
This is technical analysis for informational purposes only and does not constitute financial advice or a recommendation to buy or sell any instrument.
US Wall Street 30 index history (2024–2026)
The US Wall Street 30 index was trading around $39,154 in early April 2024, before climbing steadily through the second half of that year, passing $41,000 in July, $42,000 in September, and reaching a year-end 2024 close of $42,509.
2025 brought sharper moves. The index drifted to $41,908 at the end of March before the announcement of sweeping US import tariffs on 2 April 2025 triggered a rapid sell-off, with US30 touching $36,965 on 6 April – the lowest level in the two-year dataset. A recovery followed through the spring and summer, with the index reclaiming $44,000 by July and $47,500 by November, before closing 2025 at $48,067.
The index pushed higher into early 2026, reaching a dataset peak of $50,268 on 10 February, before pulling back amid renewed tariff concerns and softer macro data. By 11 March 2026, it had retreated to $47,034, and further weakness brought it to $45,060 on 27 March.
US Wall Street 30 closed at $46,756 on 1 April 2026, approximately -2.9% year to date from the 1 January 2026 open of $48,129, but around 11.2% up year on year from the 1 April 2025 close of $42,030 and roughly 26.5% above the April 2025 tariff-shock low of $36,965.
Past performance is not a reliable indicator of future results. Share prices are indicative and may differ from live market prices.
US Wall Street 30 (US30): Capital.com analyst view
The US Wall Street 30's trajectory over the past two years reflects the tension between strong corporate earnings momentum and persistent macro headwinds. The index climbed from around $39,000 in April 2024 to a dataset peak of $50,268 in February 2026, supported by AI-driven capital expenditure, resilient US labour markets, and expectations of Federal Reserve rate cuts. However, the same period also illustrated the index's sensitivity to policy shifts – the April 2025 tariff announcement triggered a drop to $36,965 within days, which showed that trade policy developments can rapidly offset broader supportive factors.
More recently, US30 has pulled back from its February 2026 highs to around $46,740, as renewed tariff uncertainty and softer macro data weighed on sentiment. Some analysts may point to stabilising oil prices and easing Treasury yields as potential supports; others may focus on the fact that the index remains below its 50- and 100-day SMAs, and that unresolved trade tensions could continue to dampen risk appetite. The range of outcomes remains wide.
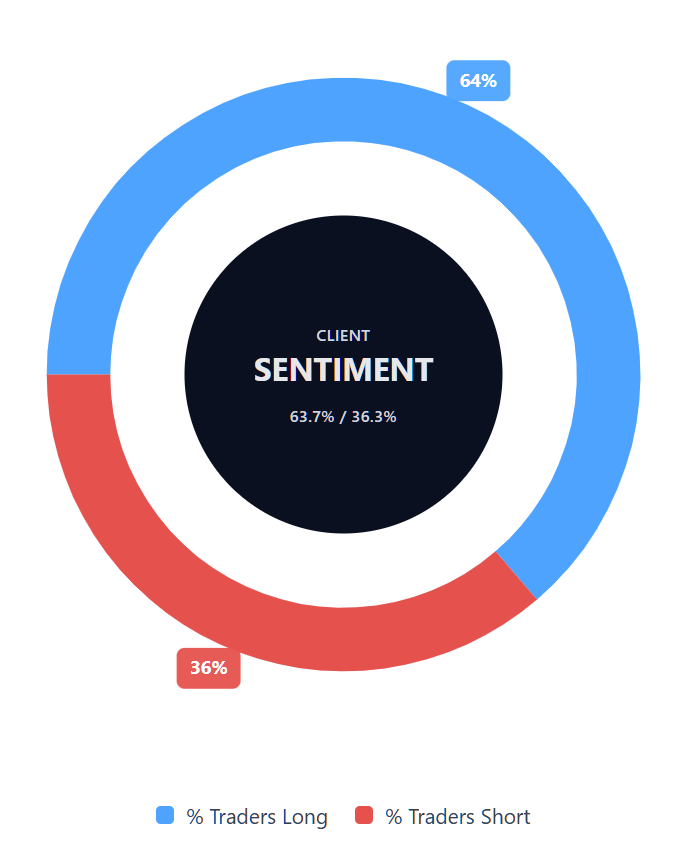
Capital.com’s client sentiment for US Wall Street 30 CFDs
As of 1 April 2026, Capital.com client positioning in US Wall Street 30 CFDs shows 63.7% buyers and 36.3% sellers, which keeps it in majority-buy territory but below an extreme, with buyers ahead by 27.4 percentage points. This snapshot reflects open positions on Capital.com and can change.
Summary – US Wall Street 30 2026
- As of 4:07pm UTC on 1 April 2026, US30 is trading at $46,740.0, within an intraday range of $45,112.3 to $46,756.7.
- The April 2025 tariff shock drove US30 to a two-year low of $36,965 on 6 April 2025; the subsequent recovery of around 26.5% underscores the index's volatility around policy events.
- Key price drivers include US trade tariff policy, Federal Reserve rate expectations, AI-linked capital expenditure trends, and the broader US labour market outlook.
- Recent news highlights include a reported easing of Iran-related geopolitical tensions, a fall in US job openings to 6.88 million in February 2026, and a technology-sector rally led by Nvidia and Marvell in late March.
Past performance is not a reliable indicator of future results.
FAQ
What is the 5 year US Wall Street 30 forecast?
A five-year forecast for US Wall Street 30 is highly uncertain, because long-term index projections depend on several variables that can change materially over time. These include US trade policy, Federal Reserve decisions, corporate earnings, labour market conditions, and broader investor sentiment. The article focuses on shorter-term third-party forecasts for 2026, which already show a wide range of outcomes. That divergence illustrates how much uncertainty remains even over one year, let alone five.
Is US Wall Street 30 a good CFD to trade?
Whether US Wall Street 30 is a suitable CFD to trade depends on your objectives, risk tolerance, trading style, and time horizon. The index can appeal to traders because it is widely followed and reacts to macroeconomic data, policy developments, and earnings trends. At the same time, those same factors can drive sharp moves in either direction. As a result, it may suit some traders more than others, particularly when volatility increases around major news events.
Could US Wall Street 30 go up or down?
Yes, US Wall Street 30 could move in either direction, and the article reflects that balanced view. Supportive factors may include easing Treasury yields, softer oil prices, improving rate-cut expectations, or strength in major sectors such as technology. On the other hand, tariff developments, weaker macro data, or renewed geopolitical tensions could weigh on sentiment. Technical levels also suggest mixed conditions, with some shorter-term indicators improving while several medium-term moving averages still point to resistance overhead.
Should I invest in US Wall Street 30?
The article does not say whether you should invest in US Wall Street 30, because that would depend on your personal circumstances and could amount to investment advice. Instead, it outlines the index’s recent price history, technical backdrop, third-party forecasts, and key macro drivers. That information may help you build a more informed view, but any decision to invest should take account of your own financial goals, risk tolerance, and understanding of the product you are considering.
Can I trade US Wall Street 30 CFDs on Capital.com?
Yes, you can trade US Wall Street 30 CFDs on Capital.com. Trading index CFDs lets you speculate on price movements without owning the underlying asset and to take long or short positions. However, contracts for difference (CFDs) are traded on margin, and leverage amplifies both profits and losses. You should ensure you understand how CFD trading works, assess your risk tolerance, and recognise that losses can occur quickly.