Trading Silver’s 35% Pullback
Volatile technical overview has given conformist breakout strategies the clear edge as of late, while in sentiment it remains a majority buy story.
Traders within the precious metals sphere have woken up to a sea of red at the start of this week, but last Friday’s plunge was the wake-up call. Gold fell from its near-$5,600 record high to get as low as $4.4K this morning before the partial lift, with a far larger percentage drop for silver intraday undoing all of this year’s gains and down over a third from its record high last week.
Fundamentals had seemingly broken down prior, but a trigger was seen occurring from news of Kevin Warsh’s nomination for Federal Reserve (Fed) chair, a more established pick compared to others like Hasset and seen as less worrisome in terms of hurting the central bank’s independence credibility, and triggering profit-taking after months of historic gains.
Both gold and silver are non-yielding precious metals, and Treasury yields fell back but not on the furthest end of the curve, as the bond market digested hotter-than-expected producer pricing data and President Trump’s nomination of Kevin Warsh as the next Fed chair. Rates still matter, and market pricing (CME’s FedWatch) continues to anticipate a hold on rates until June where via majority we’ll get the first 25bp (basis point) rate cut of the year, with the second and final one of 2026 potentially in September.
Politically, the U.S. government shut down but a House vote is expected soon that could see it reopen as early as tomorrow, at least according to House Speaker Johnson. We did hear from a few FOMC (Federal Open Market Committee) members, the Fed’s Bostic that inflation is too high and wants clear evidence of a return to 2%, Waller that he dissented in their most recent meeting wanting a 25bp rate cut as policy is still restricting activity too much, and Musalem that further rate cuts are not advisable as policy is now neutral and the economy does not need stimulus.
In terms of economic data, hotter pricing data didn’t help, with PPI (Producer Price Index) for the month of December up 0.5% m/m (month-on-month) for headline vs 0.2% expectations and by a larger 0.7% for its core (which excludes food and energy) both translating into significant figures when annualized, and y/y (year-on-year) saw the headline hold at 3% instead of drop while its core rose to 3.3%. Chicago PMI (Purchasing Managers’ Index) improved notably from 43.5 to 54 emerging from contraction for the first time in over two years.
Week ahead
We’ll get manufacturing PMIs today, JOLTS job openings tomorrow, ADP’s non-farm estimate and services PMIs on Wednesday, the weekly claims and Challenger’s job cuts on Thursday, and the market-moving Non-Farm Payrolls on Friday where disappointing jobs growth in January is what’s expected. In earnings, Palantir and Disney today, AMD, PepsiCo, and Pfizer tomorrow, Alphabet, Eli Lilly, and Uber on Wednesday, Amazon and Shell on Thursday, and Philip Morris on Friday. In terms of central bank decisions both the European Central Bank and Bank of England are expected to hold on rates this Thursday, but the interesting one is the Reserve Bank of Australia tomorrow where they could hike rates.
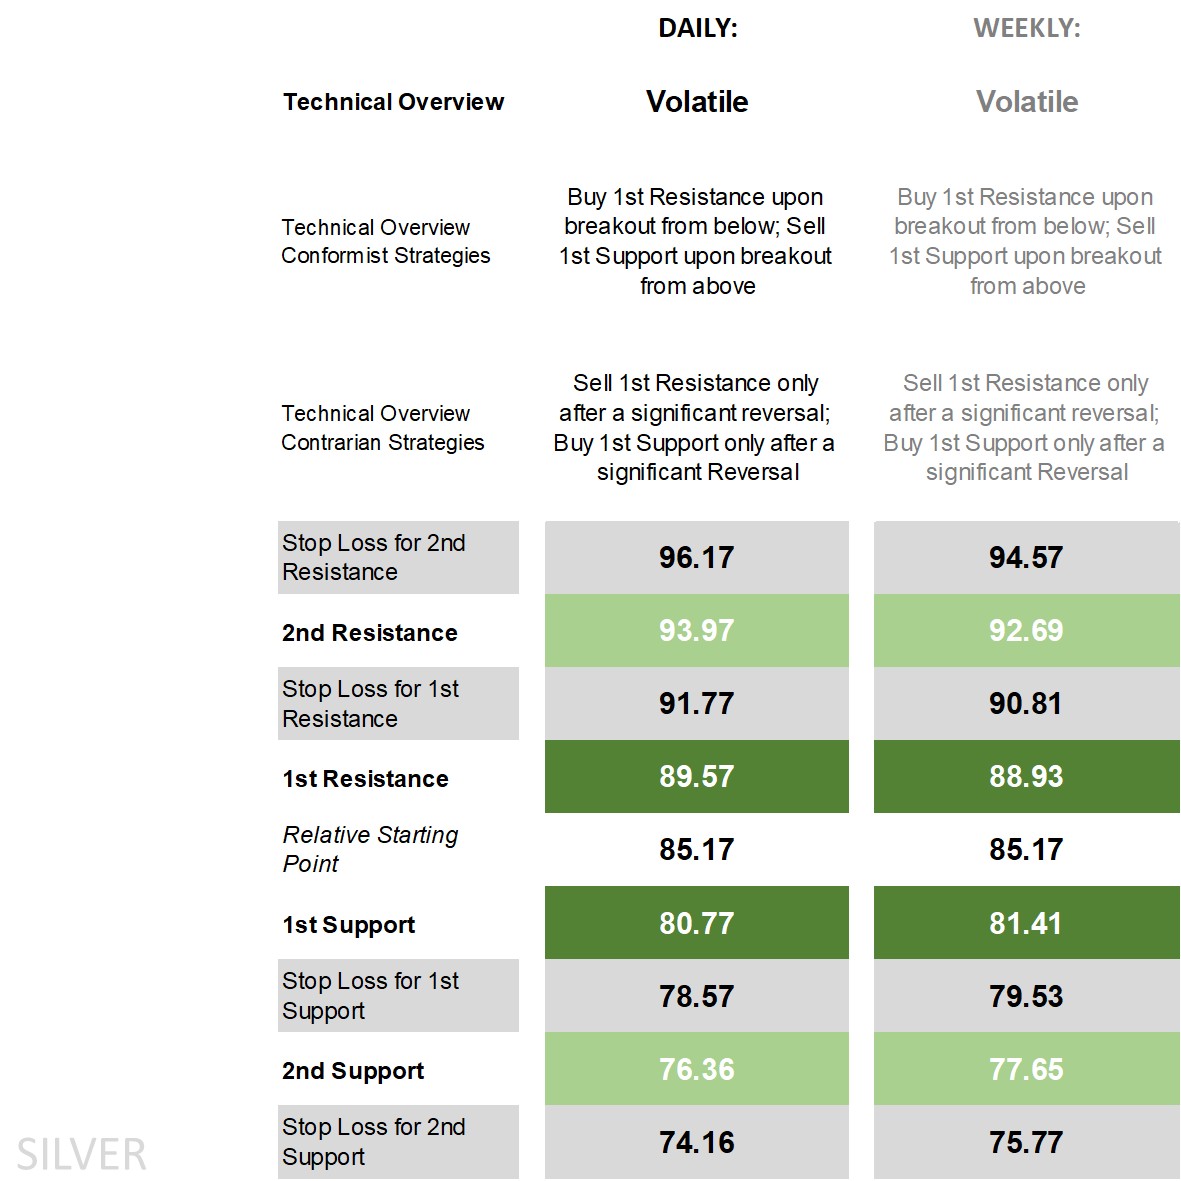
Silver's technical overview, strategies and levels
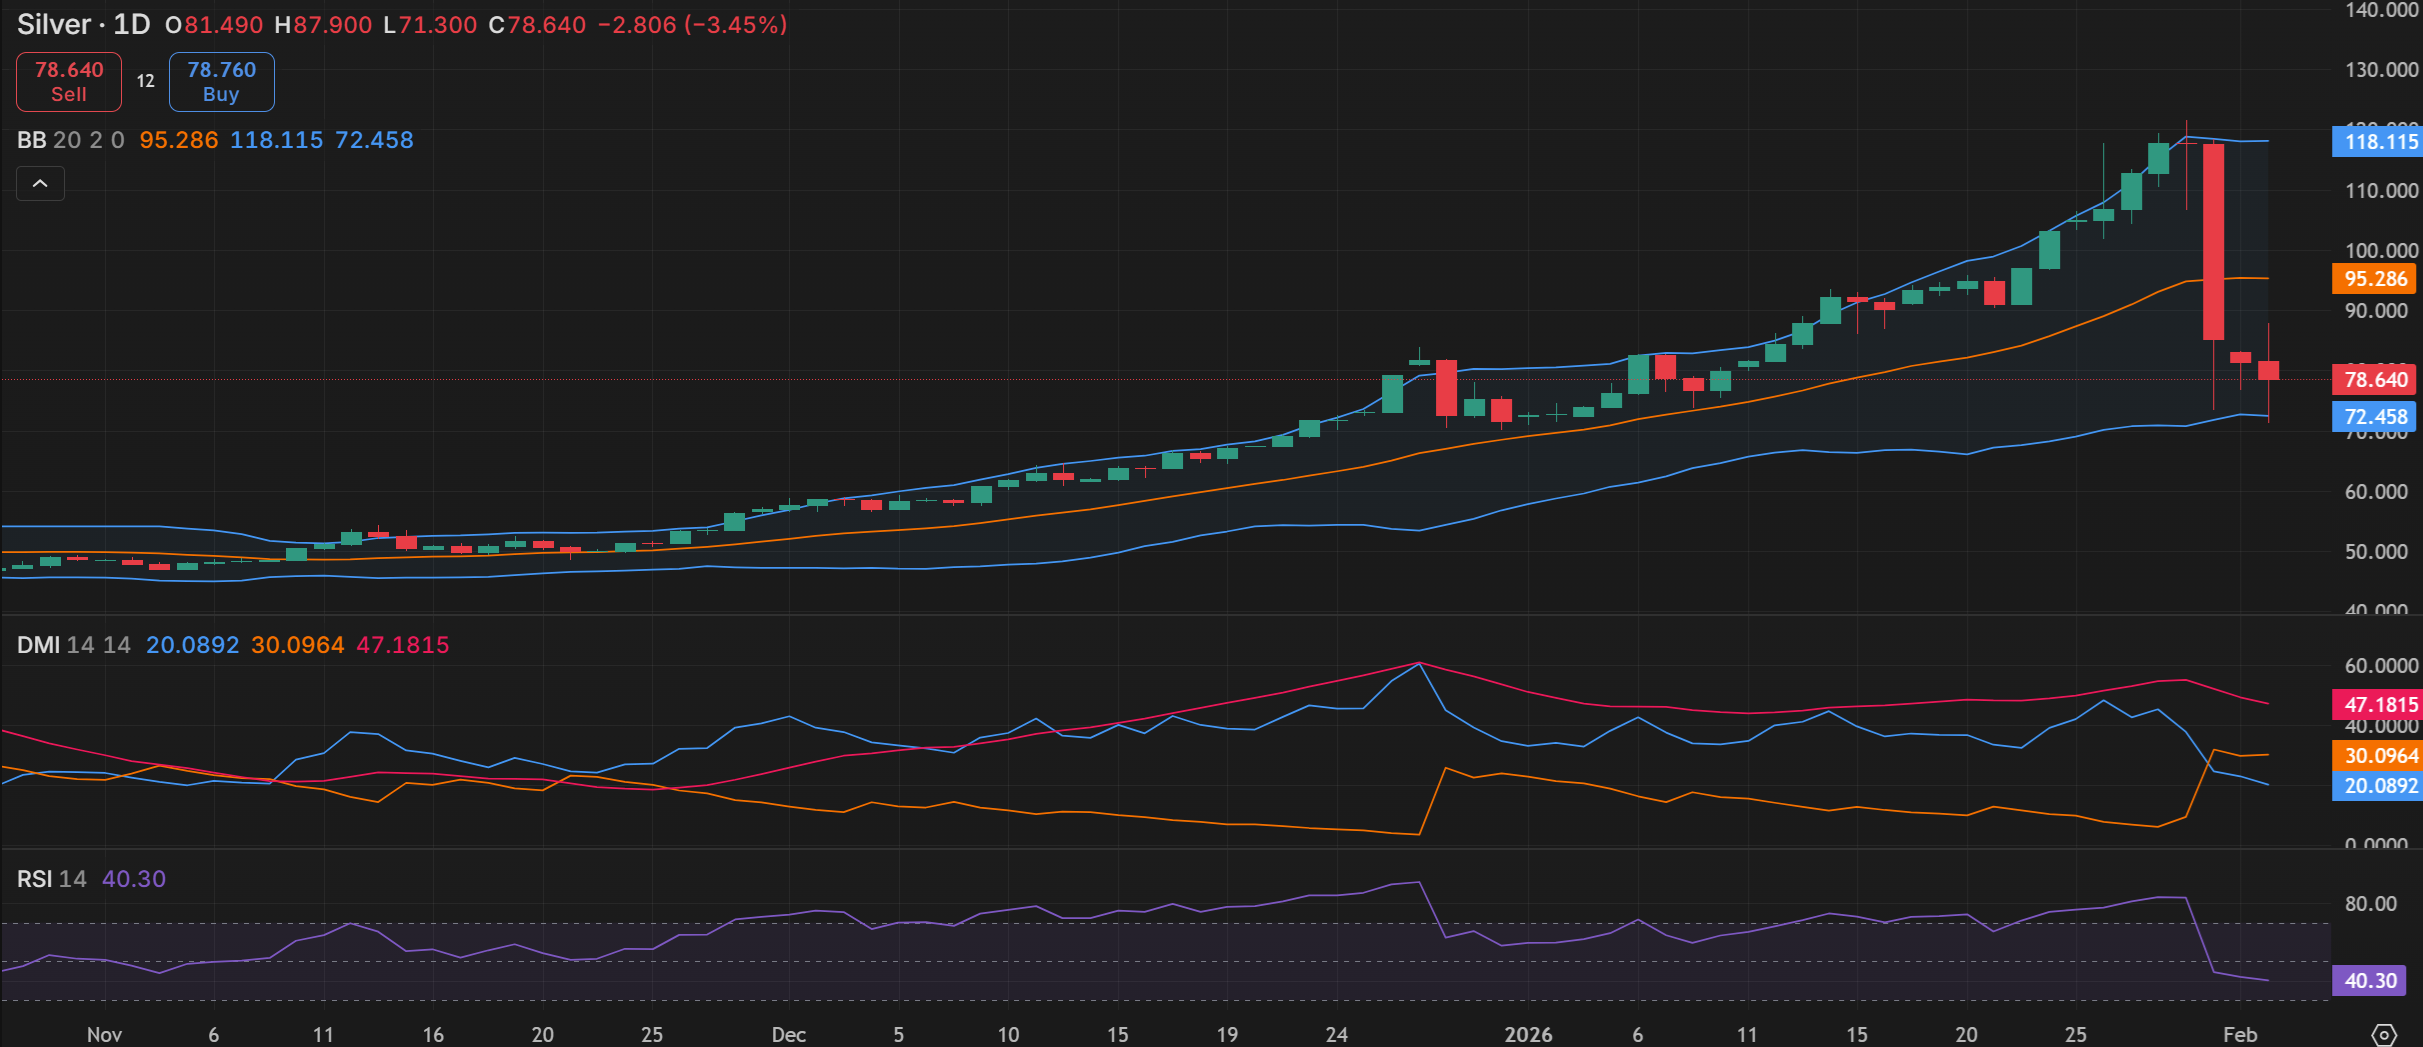
Looking at the daily time frame and price is now beneath all its main short-term moving averages (MA) while still above its main long-term ones, reaching the lower end of what are clearly widened Bollinger Bands, on the DMI (Directional Movement Index) front the -DI crossing over the +DI though yet to classify it as negative (in relative terms), an RSI (Relative Strength Index) plummeting out of overbought territory even if yet to reach oversold, and an ADX (Average Directional Movement Index) still well in trending territory. We’ve also seen some moves away from key indicators on the weekly time frame though the weekly +DI is still above the -DI, and price still not too far off the upper end of the weekly Bollinger Band.
The technical overview? It was and still is ‘volatile’, and in both daily and weekly time frames. That has meant breakout strategies remain in the conformist camp, whether buying off the 1st Resistance level or shorting the 1st Support, while significant reversals are reserved for contrarians. It’s quite clear at this stage that conformist breakouts (net) clearly outperformed against contrarian strategies both last week and at the start of this week, but to continue doing so will require that the uptick in volatility occurs at a faster pace than the widening of both intraday and intraweek 1st levels attempting to adjust to incorporate a jumpier market.
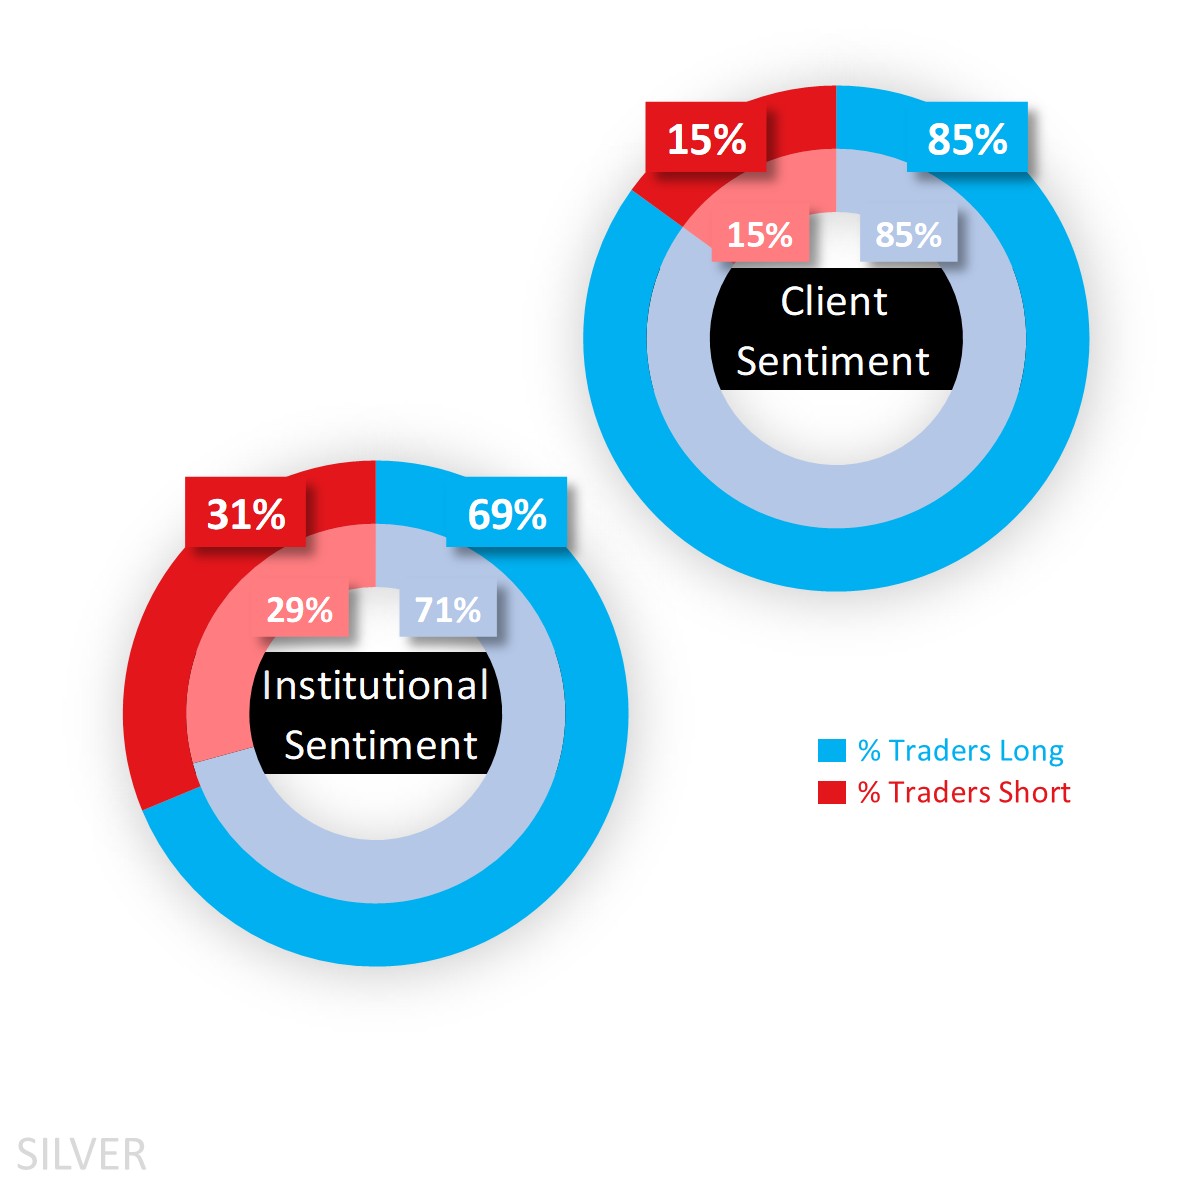
Capital.com’s client sentiment for Silver
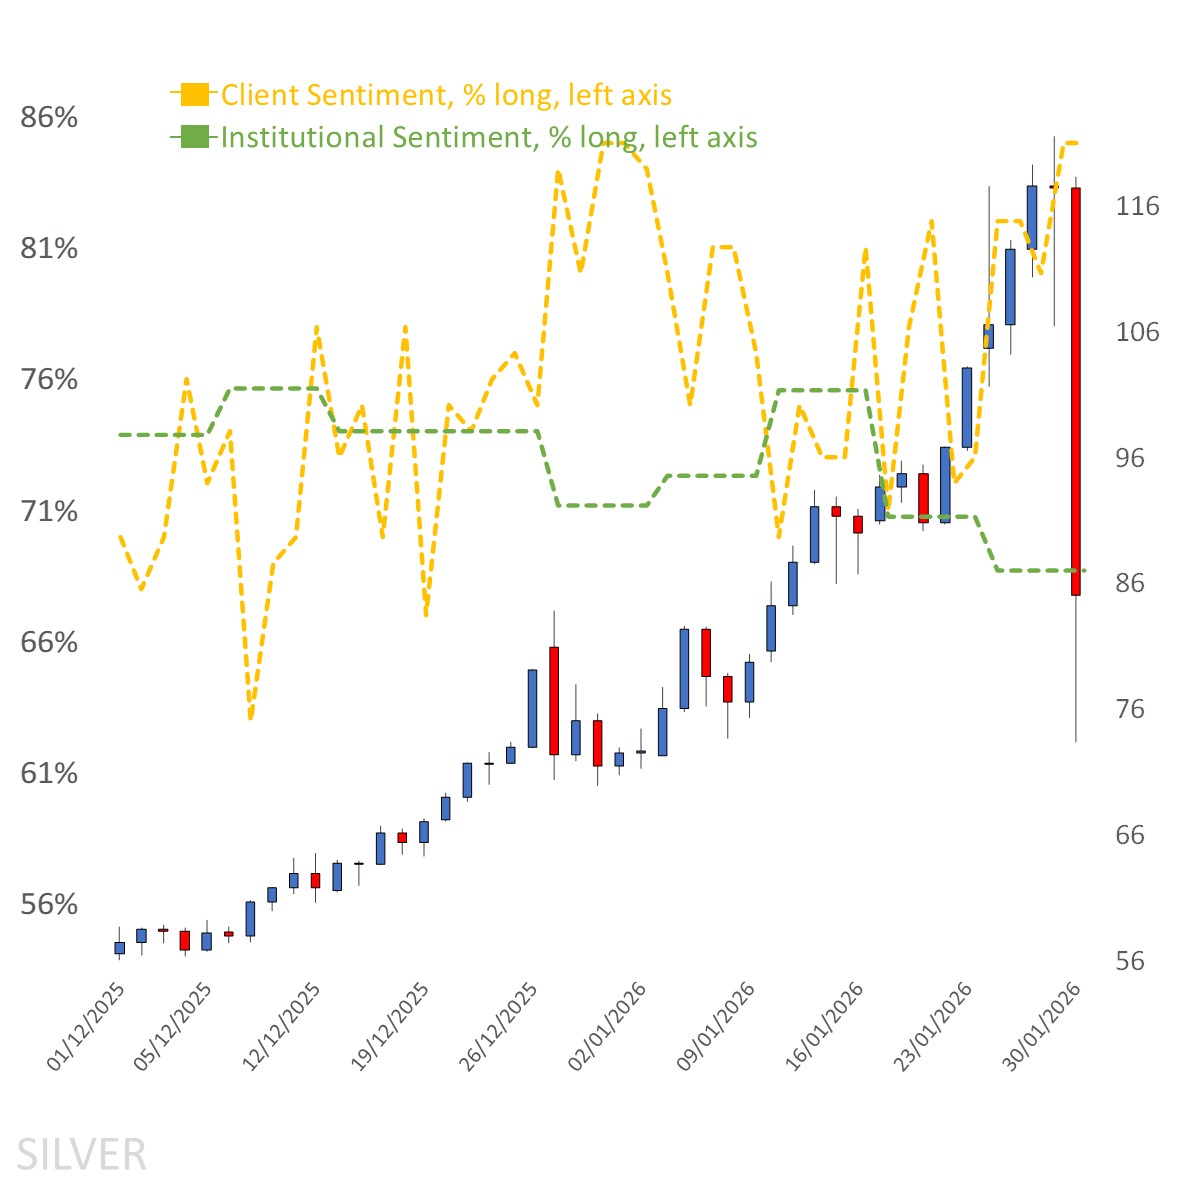
Client sentiment started off the week in extreme buy territory at 85% and unchanged from last Friday before the plummet, with the ongoing losses forcing longs out and reducing that bias a few notches to 82% as of writing. Looking at sentiment mapped onto the chart below and longs were looking for a chance to unwind when price made the initial climb before trying to latch onto the trend, and at the start of last week they were heavy buy 73%.
CoT speculators were and remain net long and in heavy buy territory, but they trimmed their long sentiment a couple notches due to a larger increase in shorts (+2,021 lots) over longs (+510). Gold net long sentiment was also reduced albeit by only a notch, and due to a far larger drop in longs (-43,672 lots) over shorts (-4,298). Keep in mind that a chunk of longs were initiated at far lower levels meaning while a pullback isn’t favorable for them, they still have a margin to ensure they (net) close out in profit.
Client sentiment mapped on the daily chart
 Source: Capital.com
Period: DECEMBER 2025 – JANUARY 2026
Past performance is not an indicator of future results.
Silver’s chart on Capital.com’s platform with key technical indicators
 Source: Capital.com
Period: OCTOBER 2025 – FEBRUARY 2026
Past performance is not an indicator of future results.