Silver price forecast: China export curbs tighten supply
Silver (XAG/USD) is trading near $86.93 as China’s 2026 export curbs may be tightening supply, while DXY holds around 99.4 and US CPI is 2.4% y/y. Explore third-party silver price targets and technical analysis. Past performance is not a reliable indicator of future results.
Silver (XAG/USD) is trading at $86.928 per troy ounce as of 9:47am UTC on 12 March 2026, within an intraday range of $84.391–$88.947 on Capital.com. Past performance is not a reliable indicator of future results.
Support for silver in the current session comes from a combination of ongoing safe-haven demand linked to Middle East geopolitical tensions (Reuters, 28 February 2026) and a structural global supply deficit, as China's export restrictions – effective from 1 January 2026 – have restricted exports of some refined silver, tightening physical availability (Investing News Network, 13 January 2026). The US dollar index (DXY) is trading near 99.4, a firmer level that has capped upside (Trading Economics, 12 March 2026), while Wednesday's US CPI print of +2.4% year on year for February came in broadly in line with expectations, keeping Federal Reserve rate-cut expectations for 2026 broadly steady and providing a broadly neutral macro backdrop for the metal (CNBC, 11 March 2026).
Silver price forecast 2026-2030: Analyst price target view
As of 12 March 2026, third-party Silver predictions reflect sharply divergent views on the metal's trajectory through 2026, shaped by structural supply deficits, industrial demand shifts, geopolitical risk, and Federal Reserve policy expectations. The following targets summarise leading third-party projections published between 28 February and 12 March 2026.
J.P. Morgan Global Research (2026 annual average)
J.P. Morgan Global Research forecasts an average silver price of $81/oz for full-year 2026, with quarterly projections of $84/oz in Q1, $75/oz in Q2, $80/oz in Q3, and $85/oz in Q4. Strategist Gregory Shearer cites multi-year physical supply deficits, elevated speculative positioning, and risk of demand destruction in solar applications as key variables, adding that the bank remains cautious on re-engaging in the near term until excess speculative demand clears (J.P. Morgan Global Research, 10 February 2026).
FXStreet (near-term technical range)
FXStreet notes that XAG/USD recovery momentum stalled below a key resistance hurdle near $86.15, with the 100-hour exponential moving average acting as a barrier to further upside. The report flags a break above $86.15 as necessary to target the $88–$89 zone, while support is identified near $84, as a firmer US dollar and mixed risk sentiment keep the metal range-bound in the near term (FXStreet, 12 March 2026).
FX Leaders (bullish multi-analyst range)
FX Leaders reports that Bank of America forecasts silver reaching $135/oz in 2026, citing a narrowing gold-to-silver ratio near 59:1 alongside accelerating industrial demand. The report also notes that some independent analysts are calling for triple-digit silver prices, with $100/oz flagged as a key psychological barrier where a sustained break could trigger short-covering across futures desks (FX Leaders, 3 March 2026).
Finance Magnates (institutional consensus range)
Finance Magnates sets out an institutional range spanning J.P. Morgan's $81/oz average to Bank of America's $309/oz bull case for 2026, with independent analysts projecting $185–$260/oz based on physical shortage theses and Eastern market price-discovery dynamics. Technical analysis cited in the report places $120/oz as the first major target on a break above $94/oz, with $136/oz as a full Fibonacci extension target, while $80/oz is identified as mid-channel support (Finance Magnates, 10 March 2026).
CoinCodex (algorithmic 2026 range)
CoinCodex projects XAG/USD trading between approximately $80.02–$111.95/oz at mid-2026, with an average near $92.49/oz, widening to $163.81–$229.18/oz by year-end. The model flags high expected volatility and sharp near-term fluctuations, predicting a price of approximately $82.53/oz, amid sensitivity to speculative positioning and macro sentiment shifts (CoinCodex, 12 March 2026).
Predictions and third-party forecasts are inherently uncertain, as they cannot fully account for unexpected market developments. Past performance is not a reliable indicator of future results.
Silver price: Technical overview
Silver spot prices trades at $86.928 as of 9:47am UTC on 12 March 2026, holding above its key moving-average cluster – the 20/50/100/200-day SMAs at approximately $84, $86, $71 and $55 – with a 20-over-50 alignment intact across both the simple and exponential families, keeping the near-term trend constructive. The 100-day and 200-day SMAs sit well below current price, reflecting the scale of the rally from lower levels earlier in the year.
Momentum is broadly neutral: the 14-day RSI reads 52.5, consistent with mid-range consolidation rather than either overextension or deterioration. The average directional index at 15.4 sits just above the weak-trend threshold, suggesting the current move lacks strong directional conviction.
On the upside, the first reference is the classic R1 pivot near $104.07; a convincing daily close above that level would put R2 near $114.84 in view. The $88.947 intraday high from today's session marks the immediate near-term ceiling before the pivot sequence becomes relevant.
On pullbacks, the classic pivot at $83.98 provides initial support, roughly coinciding with the 20-day SMA near $83.98; a sustained move below that shelf would risk a deeper retracement toward the S1 level near $73.21. The 50-day SMA near $85.81 also sits close to current price and may act as a short-term reference on intraday weakness (TradingView, 12 March 2026).
This is technical analysis for informational purposes only and does not constitute financial advice or a recommendation to buy or sell any instrument.
Silver price history (2024–2026)
The Silver spot price opened 2024 trading near $29 per troy ounce and spent much of the first half of the year consolidating in the $26–$32 range. A push higher through mid-May 2024 briefly lifted the price toward $32.54 on 20 May, before a retreat back below $27 into early August, when the metal hit a local low of $26.49 on 5 August amid broader commodity weakness.
Recovery momentum built through the second half of 2024, with silver climbing back toward $34–$35 by late October before settling around $28.91 at the close of 2024. The metal entered 2025 near $29 and traded in a narrow $29–$34 band through the first half of the year, before breaking higher in the autumn, reaching the low $50s by early November 2025 and closing out December 2025 near $71.65.
The move accelerated sharply in early 2026. Silver surged through $90 to reach an intraday peak of $121.69 on 29 January 2026, before a steep pullback dragged it back toward $64 on 6 February. The metal partially recovered and has since stabilised in the $82–$96 range through February and into March 2026.
Silver (XAG/USD) last traded at $86.928 on 12 March 2026, compared with $33.297 on the same date one year ago, a gain of approximately 161% year on year. Against the 31 December 2024 close of $28.911, the price is up approximately 201% since that point.
Past performance is not a reliable indicator of future results. Share prices are indicative and may differ from live market prices.
Silver price outlook: Capital.com analysis
Silver's price performance over the past year has been unusually strong by historical standards, with XAG/USD surging from around $33 in March 2025 to trade near $87 in March 2026 – a gain of roughly 161% year on year. The rally drew support from a structural physical supply deficit, China's export restrictions on refined silver, and strong investment demand, while the metal's dual role as both an industrial commodity and a safe-haven asset attracted a broad range of market participants. That said, the move has not been one-directional: the sharp pullback from $121.69 in late January 2026 to below $65 in early February illustrated how quickly sentiment can reverse, particularly when speculative positioning becomes stretched.
Looking at current conditions, silver continues to draw support from persistent supply-demand imbalances and geopolitical uncertainty, which may sustain investor interest; however, a stronger US dollar, softening industrial demand, or a reduction in safe-haven appetite could equally weigh on prices from current levels. The metal's elevated volatility relative to gold means moves in either direction can be amplified, and the wide intraday ranges seen in recent sessions – such as the $79.70–$88.06 range on 9 March 2026 – reflect that dynamic clearly.
Capital.com’s client sentiment for Silver CFDs
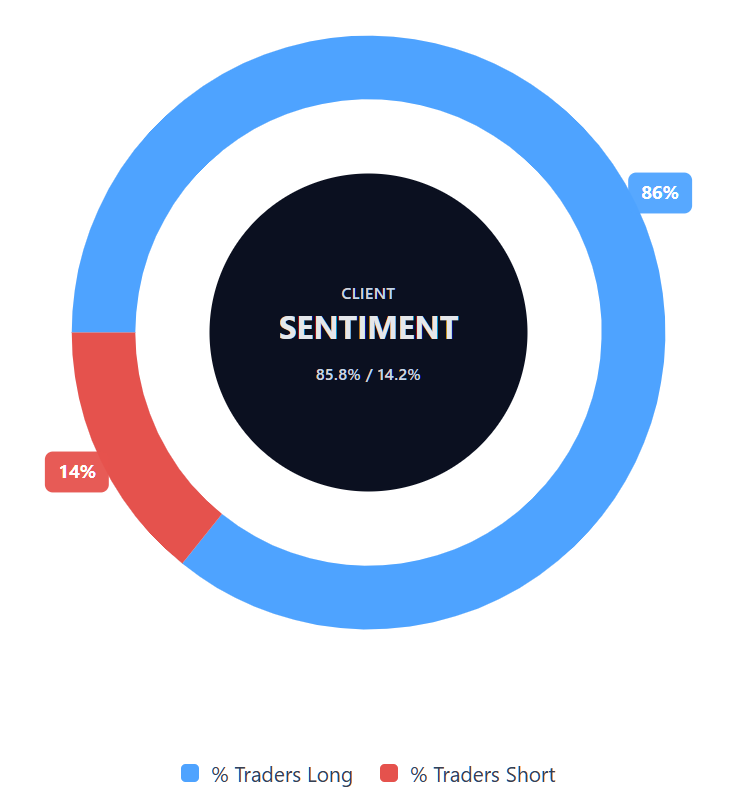
As of 12 March 2026, Capital.com client positioning in Silver spot CFDs shows 85.3% buyers vs 14.7% sellers, putting buyers ahead by 70.6 percentage points – a buyer-heavy, one-sided skew toward longs. This snapshot reflects open positions on Capital.com at the time of capture and can change rapidly as market conditions shift.
Summary – Silver price 2026
- Silver (XAG/USD) trades at $86.928 as of 9:47am UTC on 12 March 2026, up approximately 161% year on year from $33.30 on 12 March 2025.
- Price surged to an intraday peak of $121.69 on 29 January 2026 before a sharp pullback to below $65 in early February, with the metal since stabilising in the $82–$96 range.
- Technical indicators are broadly neutral: the 14-day RSI reads 52.5, the average directional index sits at 15.4 (weak trend), and the classic pivot at $83.98 marks the nearest support level.
- All key moving averages from the 10-day through to the 200-day signal a buy, though the hull moving average flags a near-term sell, reflecting the recent consolidation phase.
- Key price drivers include China's silver export restrictions effective January 2026, a sixth consecutive annual physical supply deficit, and persistent safe-haven demand linked to Middle East geopolitical tensions.
Past performance is not a reliable indicator of future results.
FAQ
What is the silver price forecast?
Could silver’s price go up or down?
Should I invest in silver?
Can I trade silver CFDs on Capital.com?
Yes, you can trade Silver CFDs on Capital.com. Trading commodity CFDs lets you speculate on price movements without owning the underlying asset and to take long or short positions. However, contracts for difference (CFDs) are traded on margin, and leverage amplifies both profits and losses. You should ensure you understand how CFD trading works, assess your risk tolerance, and recognise that losses can occur quickly.