Gold price forecast: Softer CPI, DXY firmer
Gold (XAU/USD) trades near $5,190 after softer US CPI, with DXY around 99.45 and Brent above $80. January gold ETF inflows totalled $18.7bn, according to the WGC. Past performance is not a reliable indicator of future results. Explore third-party Gold price targets and technical analysis.
Gold (XAU/USD) is trading at $5,190.23 as of 10:02am UTC on 12 March 2026, according to Capital.com's quote feed, within the session's intraday range of $5,138.45 –$5,218.48. Past performance is not a reliable indicator of future results.
Prices remain under pressure as the US Dollar Index (DXY) moved toward 99.45 after February CPI data came in softer than expected, creating a short-term headwind for bullion (Exchange Rates UK, 11 March 2026) while still leaving scope for further Federal Reserve rate cuts (FXEmpire, 10 March 2026); meanwhile, disruptions linked to Middle East tensions have sustained an energy risk premium, with Brent crude holding above $80/barrel and supporting the view of gold as an inflation and uncertainty hedge (Investing.com, 4 March 2026). Structural support from central banks also remains a factor, with World Gold Council data showing global physically backed gold ETFs recorded $18.7 billion in inflows in January 2026, led by North American and Asian buyers (World Gold Council, 5 February 2026).
Gold price forecast 2026-2030: Analyst price target view
As of 12 March 2026, third-party gold predictions show year-end and 12-month targets clustering between $5,400 and $6,300/oz, as institutions revised higher in response to sustained central bank demand, Federal Reserve policy uncertainty, and elevated geopolitical risk.
ING Think (quarterly path and full-year 2026 average)
ING Think projects gold averaging approximately $4,900/oz in Q1 2026, rising through $5,100 in Q2 and $5,300 in Q3 to around $5,450 in Q4, with a full-year 2026 average of roughly $5,190/oz. The bank grounds this quarterly profile in resilient investment demand, real-yield dynamics, and sustained central bank activity as primary inputs (ING Think, 2 March 2026).
Bank of America (12-month price target)
Bank of America sets a 12-month gold price target of $6,000/oz, updated as gold futures traded near $5,208/oz at the time of publication. Analysts cite three drivers: uncertainty around Federal Reserve leadership, persistent US fiscal deficits, and historically low investor allocations to the metal, arguing these factors could sustain structural upside (TheStreet, 28 February 2026).
BNP Paribas (2026 annual average and peak scenario)
BNP Paribas raised its 2026 average gold price forecast by 27%, lifting the estimate to $5,620/oz, with a peak above $6,250/oz flagged as probable. The bank links the upward revision to a broadening of haven demand as investors reassessed macro risks, with the revised forecast issued amid gold's sharp correction from the late-February peak above $5,400/oz (Reuters, 3 March 2026).
Wells Fargo (year-end 2026 target range)
Wells Fargo maintains a year-end 2026 target range of $6,100 –$6,300/oz, noting that some investors may view pullbacks as opportunities within a broader uptrend. The bank cites ongoing fiscal deficit concerns and gold's role as a hedge against policy uncertainty as the basis for the elevated range, noting that the metal's structural demand backdrop remains intact (CNBC, 10 February 2026).
J.P. Morgan (year-end 2026 and long-term reset)
J.P. Morgan sets a year-end 2026 gold price target of $6,300/oz while simultaneously raising its long-term price estimate by 15% to $4,500/oz, citing strong and sustained demand from central banks, higher ETF inflows, and expectations of a weaker US dollar as the core rationale. The bank describes its conviction in gold over the medium term as strong, grounding the long-term reset in what it characterises as a structural, rather than cyclical, shift in reserve diversification trends (Investing.com, 25 February 2026).
Predictions and third-party forecasts are inherently uncertain, as they cannot fully account for unexpected market developments. Past performance is not a reliable indicator of future results.
Gold price: Technical overview
On the daily chart, the gold spot price trades at $5,190.23 as of 10:02am UTC on 12 March 2026, holding above a well-established moving-average stack with all 12 SMAs aligned to the upside. The 20/50/100/200-day SMAs sit at approximately $5,125 / $4,934 / $4,555 / $4,042, placing the current price above each layer of the cluster and keeping the broader trend positive. The 20-over-50 alignment remains intact across both the simple and exponential families.
Momentum is upper-neutral: the 14-day relative strength index reads 55.6, consistent with positive but non-stretched conditions and no immediate overbought signal. The average directional index at 11.4 is below the 15 threshold, indicating a weak trend structure at present, which suggests price may consolidate before committing to a sustained directional move.
To the topside, the classic R1 pivot at $5,572 is the nearest overhead reference; a convincing daily close above that level would put the R2 area near $5,866 in view. Given the distance between current price and R1, the $5,218 session high and the $5,400 round figure serve as near-term interim references.
On pullbacks, the classic pivot (P) at $4,987 provides the first meaningful support, with the 50-day SMA near $4,934 forming a secondary shelf just beneath. Losing the pivot zone on a closing basis would risk a move toward S1 at $4,694, which aligns broadly with the 100-day SMA shelf near $4,555 (TradingView, 12 March 2026).
This is technical analysis for informational purposes only and does not constitute financial advice or a recommendation to buy or sell any instrument.
Gold price history (2024–2026)
Gold spot prices opened March 2024 around $2,157/oz and spent the first half of that year on a steady climb, breaking above $2,300 in April before touching an intraday high of $2,431.81 on 12 April 2024. Prices pulled back through the summer, dipping toward $2,364 in late July, then recovered to close 2024 at $2,624.69 on 31 December – up roughly 22% on the year.
2025 brought a far sharper move. Gold opened January near $2,624/oz and ground higher through the first quarter, cracking $3,000 for the first time in mid-March 2025 before surging to an intraday record of $3,500.22 on 22 April. A pullback followed, dragging prices back toward $3,120 in early May, but the metal found its footing and spent the rest of the year in a steady grind – recovering through summer, reclaiming $3,800 by October, and closing 2025 at $4,319.14 on 31 December.
Price action accelerated in early 2026. Gold surged from $4,332.35 on 2 January to an all-time intraday high of $5,598.39 on 28 January 2026, before a sharp reversal dragged prices as low as $4,403.42 on 2 February. The metal has since shown signs of stabilisation, broadly consolidating in the $5,000 –$5,420 range through February and into March.
Gold (XAU/USD) closed at $5,188.71 on 12 March 2026, approximately 20.1% up year to date and 76.5% up year on year.
Past performance is not a reliable indicator of future results. Share prices are indicative and may differ from live market prices.
Gold price outlook: Capital.com analysis
Gold's (XAU/USD) performance over the past two years reflects one of the most significant re-ratings in the metal's recent history, with prices roughly doubling from around $2,157/oz in March 2024 to current levels above $5,188/oz. The rally has drawn support from persistent central bank accumulation, reserve diversification away from the US dollar, and elevated geopolitical uncertainty – factors that have collectively supported gold's traditional role as a haven asset. That said, the path has not been linear; sharp pullbacks, including the steep reversal from the $5,598 intraday high in late January 2026 to below $4,404 within days, illustrate how quickly sentiment can shift. A de-escalation in geopolitical tensions, a stronger-than-expected US dollar, or a hawkish turn in Federal Reserve policy could weigh on prices from current levels.
The current consolidation in the $5,000 –$5,420 range may suggest the market is absorbing recent gains, though whether this represents a pause or a more sustained plateau remains unclear. Investors should note that gold's elevated price level can increase the potential magnitude of both upside moves and downside corrections, and that the factors supporting recent gains are subject to change without notice.
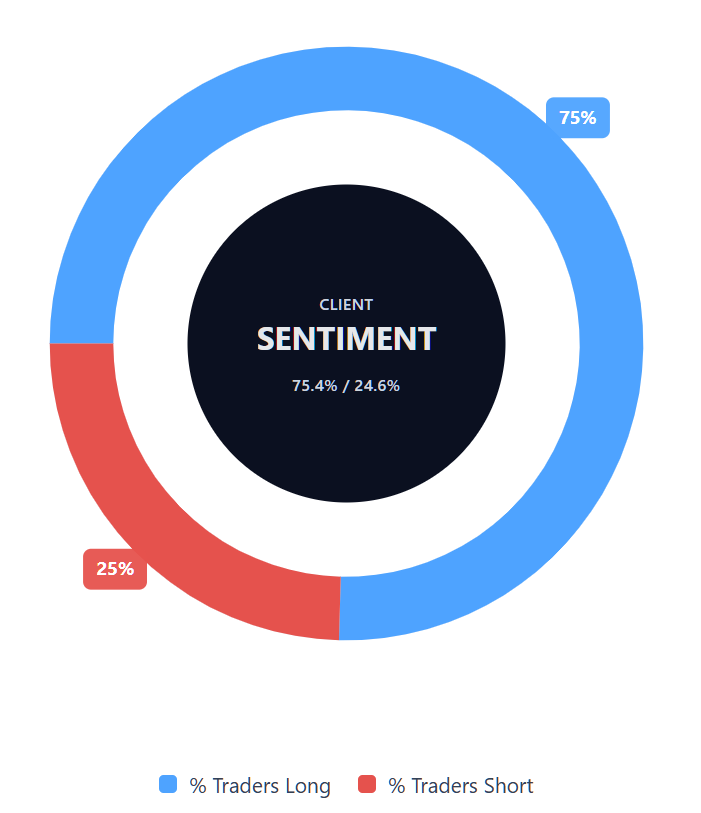
Capital.com’s client sentiment for Gold CFDs
As of 12 March 2026, Capital.com client positioning in Gold spot CFDs shows 75.4% long vs 24.6% short, which puts buyers ahead by 50.8 percentage points and places sentiment firmly in a long-leaning position. This snapshot reflects open positions on Capital.com at the time of writing and can change rapidly as market conditions evolve.
Summary – Gold price 2026
- Gold (XAU/USD) is trading at $5,190.23 as of 10:02am UTC on 12 March 2026, up roughly 20% year to date and approximately 76% year on year, after prices doubled from around $2,157/oz in March 2024.
- Technical indicators are mixed near current levels, with the 14-day RSI hovering around 56 and the ADX below 15, suggesting near-term directional uncertainty.
- Key support is noted around $5,054 –$5,154, with resistance in the $5,208 –$5,267 range; a break of $4,565 would, according to third-party technical analysis, challenge the broader uptrend.
- Primary price drivers include central bank reserve diversification, Federal Reserve rate expectations, and US dollar direction; a stronger dollar or shift in Fed policy represents a notable downside risk.
Past performance is not a reliable indicator of future results.
FAQ
What is the Gold price forecast?
Could Gold’s price go up or down?
Should I invest in Gold?
Can I trade Gold (XAU/USD) CFDs on Capital.com?
Yes, you can trade Gold CFDs on Capital.com. Trading commodity CFDs lets you speculate on price movements without owning the underlying asset and to take long or short positions. However, contracts for difference (CFDs) are traded on margin, and leverage amplifies both profits and losses. You should ensure you understand how CFD trading works, assess your risk tolerance, and recognise that losses can occur quickly.