Trading the Nasdaq 100 as Chair Powell is Under Investigation
Risk-off moves in the financial market see futures go for a dip, but it’ll require a bit more to shake off longer-term positive technicals and majority buy sentiment among traders.
A red start for U.S. equity index futures after the Department of Justice (DOJ) opened a criminal investigation into Federal Reserve (Fed) Chairman Jerome Powell regarding his testimony before the Senate on the renovation of Fed office buildings, a development that heightened concerns over central bank independence and seen as added political pressure in order to realize the real aim: that of lowering interest rates even further. Powell warned against political interference affecting monetary policy. The update has undone a chunk of last week’s gains where the S&P 500 (w/w +1.1% to 6,966) and Nasdaq 100 (w/w +1.2% to 25,766) closed higher, the Dow 30 (w/w +2.1% to 49,504) reached new record highs, but it was the small-cap Russell 2000 (w/w +4.3% to 2,624) outperforming.
Among the main tech stocks it was Intel (+10.8%) jumping sharply by the close after President Trump posted supportive comments following a meeting with its CEO highlighting the government’s shareholder position in the company, the move occurring alongside a broader rotation back into semiconductors with the VanEck Semiconductor ETF rebounding and strong gains in Lam Research (+8.7%), ASML (+6.7%) and Applied Materials (+6.9%). Tesla shares closed 2.1% higher but still ended slightly lower for the week hurt by autonomy reveals out of CES, while Meta (+1.1%) struck deals with nuclear power companies Vistra (+10.5%) and Oklo (+7.9%) to support its AI-related energy needs.
Economic data was also in focus, primarily Friday’s Non-Farm Payrolls for the month of December showing 50K growth below the 60K forecast, wage growth up 0.3% m/m (month-on-month) in line with expectations, and the unemployment rate falling slightly to 4.4% versus a forecast of 4.5% (household survey growth 232K and labor force participation drops to 62.4%), in all reflecting a labor market that’s softening but avoiding something worse. Other economic data released that day showed University of Michigan’s preliminary consumer sentiment for January improve to 54 slightly above forecast, with year-ahead inflation expectations holding at 4.2% while 5-year expectations ticked up to 3.4% from 3.2%. Data from the housing sector showed both building permits and housing starts climb in September though suffer drops in October.
Week ahead
We’ve got mostly low-impacting items today though noting what an FOMC (Federal Open Market Committee) member might say regarding the latest probe (if they even address it). It picks up notably tomorrow with CPI (Consumer Price Index) for the month of December, producer prices and retail sales on Wednesday, and the weekly unemployment claims on Thursday where a few mostly low-impacting items will be on offer. Earnings kickoff won’t go unnoticed even with all that’s been happening, and where the attention will be on the financial heavyweights with JPMorgan tomorrow, Bank of America, Citigroup and Wells Fargo on Wednesday, and both Morgan Stanley and Goldman Sachs on Thursday. The Supreme Court didn’t rule on the legality of tariffs last Friday, with the next release of rulings expected on Wednesday and will be an added item to note.
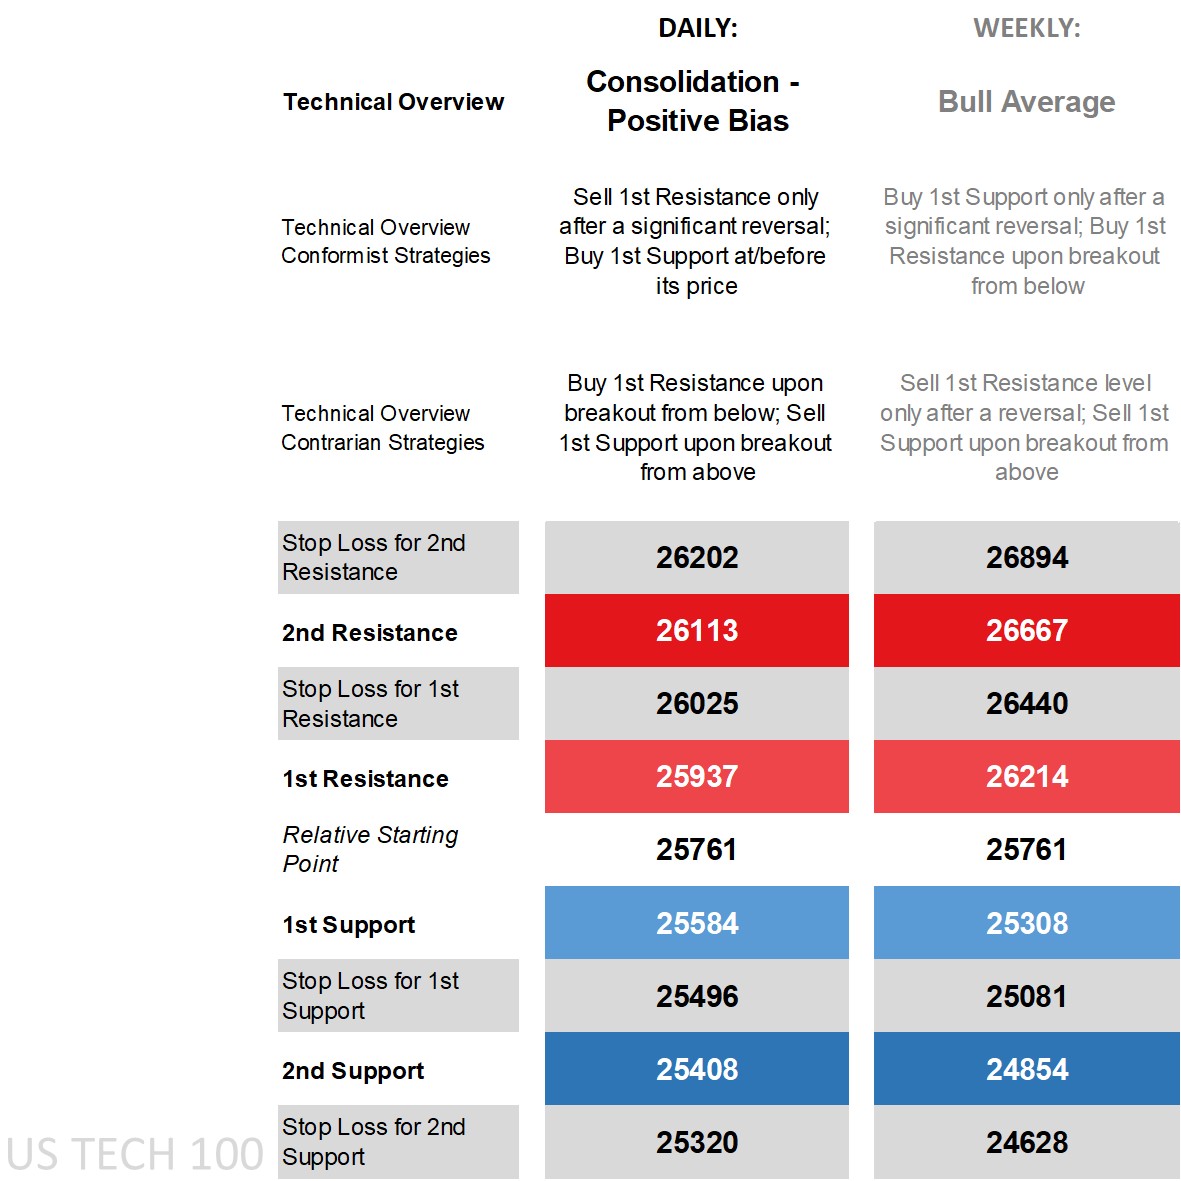
Nasdaq 100’s technical overview, strategies and levels
Looking at the daily time frame and price was above all its main moving averages (MA) by Friday’s close, on the DMI (Directional Movement Index) front the +DI over the -DI though its margin has dropped, an RSI (Relative Strength Index) tamed and not far off the middle, and an ADX (Average Directional Movement Index) yet to reach trending territory. The moves this morning have dented those technicals a bit which were otherwise showing some positive technical bias, and borrowing from the weekly’s ‘bull average’ technical overview meant technicals were relatively optimistic.
The problem is the oscillations over the past several weeks causing key technical indicators to huddle and means less will be required to shift those indicators from bullish to bearish, and in turn less reliable. Those wanting to go cautious should only go against a move to the 1st Resistance and Support levels after a significant reversal, else risk getting stopped out similar to this morning where the move went beneath today’s 1st Support level already (though has to do with the fundamental event easily overcoming a short-term technical level).
It’ll take more to reach the weekly levels given they are larger, and with a ‘bull average’ overview means conformist will be more cautious with a buy only after a significant reversal waiting for price to go beneath the 1st Support level by a significant amount before initiating only if it manages to recover to the key level, and for a breakout off the 1st Resistance. Those who see this as the start of a larger pullback are armed with contrarian strategies, via reversal off the weekly 1st Resistance and via breakout off the 1st Support.
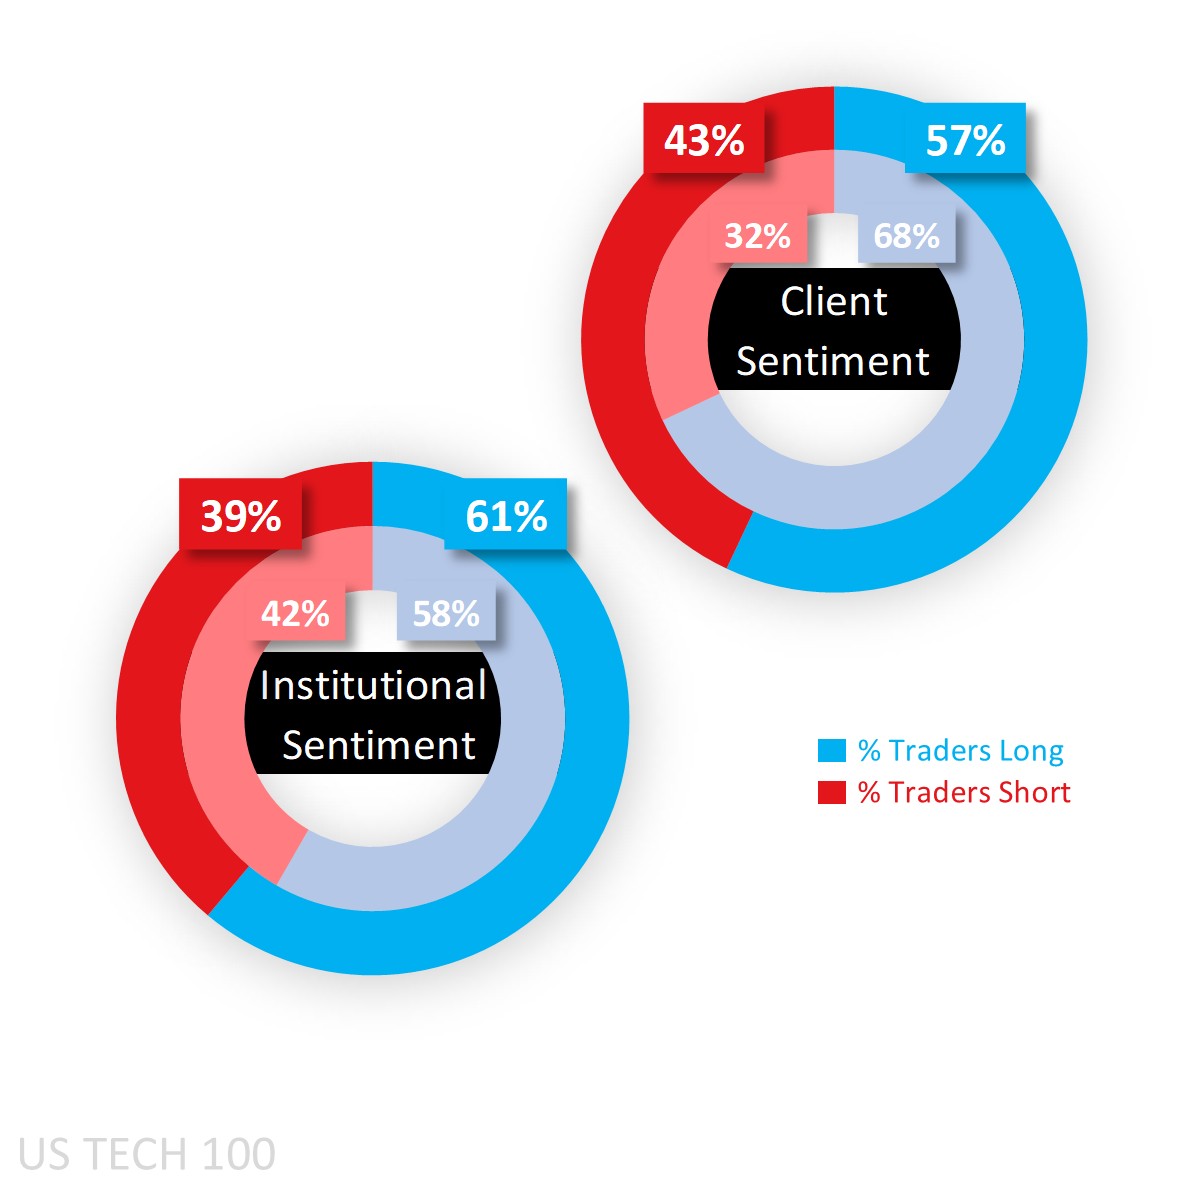
Capital.com’s client sentiment for Nasdaq 100
It’s a story of majority buy sentiment for clients, and while they were a moderate 57% at the start of this week from a heavy buy 68% at the start of Friday, the pullback this morning has taken them back into heavy long territory reaching 70% as of writing, and goes to show that a significant portion of traders are range-trading the moves even if they are fundamental in nature.
CoT (Commitment of Traders) speculators were and remain net long in the tech-heavy index, raising it from 58% to 61% in the latest report released out of the CFTC due to an increase in longs (by 1,225 lots) and a simultaneous reduction in shorts (6,708 lots). For the other key U.S. equity indices, they remain net short both S&P (59%) and Russell (51%), while have shifted in the Dow (from a slight sell 51% to a moderate net long 58%). Keep in mind this positioning is as of last Tuesday and doesn’t reflect the Powell probe update where some momentum traders might get out, and we’ll have to wait until the end of this week to see where they stand following the event.
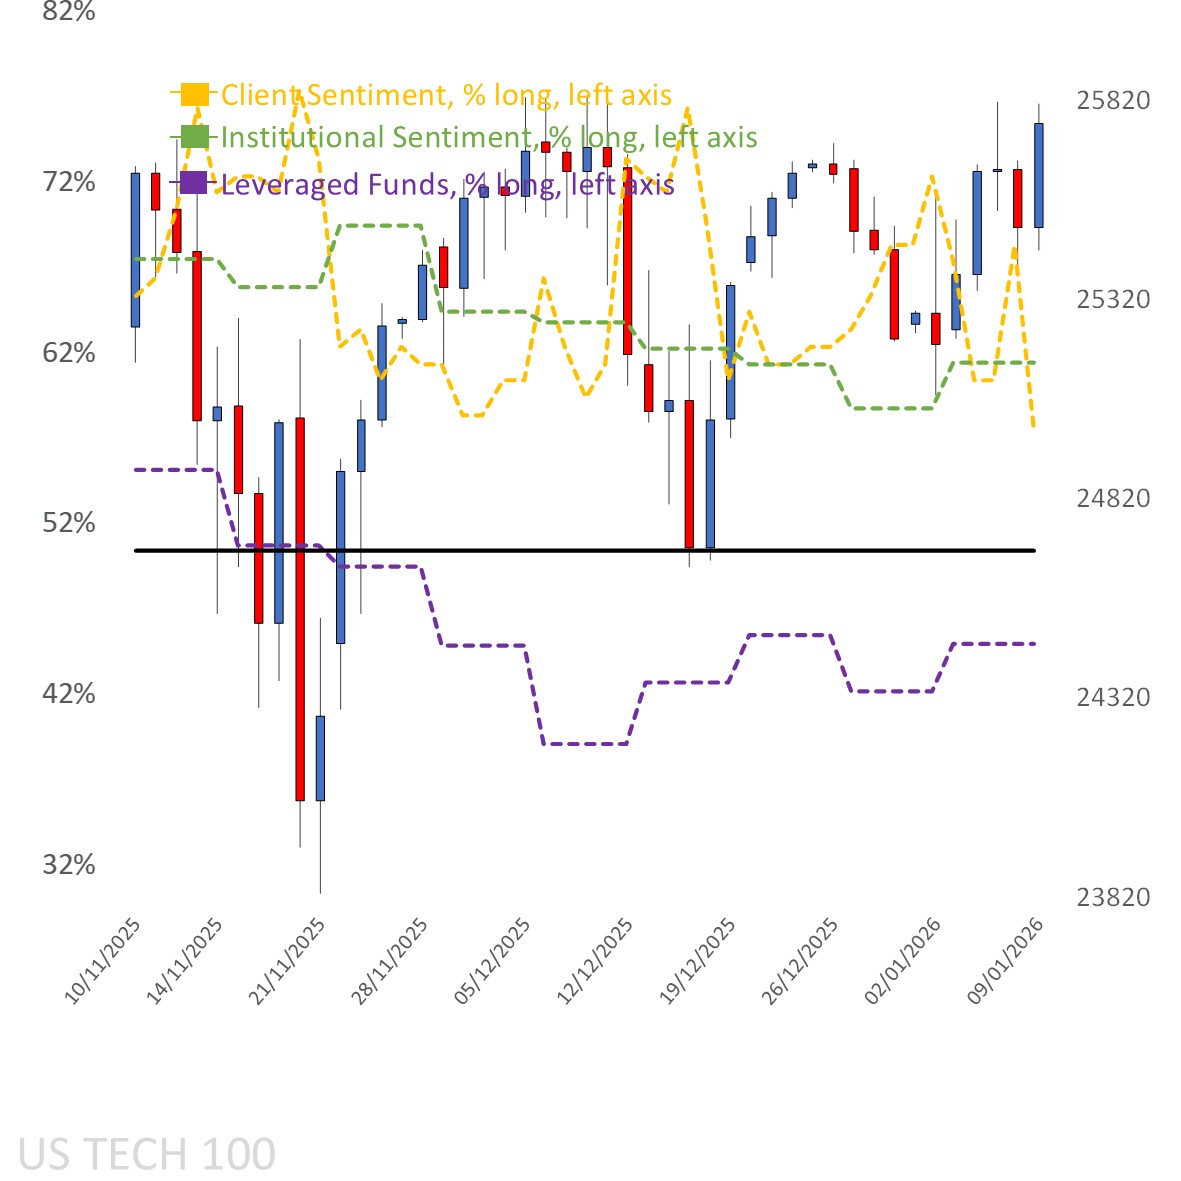
Client sentiment mapped on the daily chart
Source: Capital.com
Period: NOVEMBER 2025 – JANUARY 2026
Past performance is not an indicator of future results.
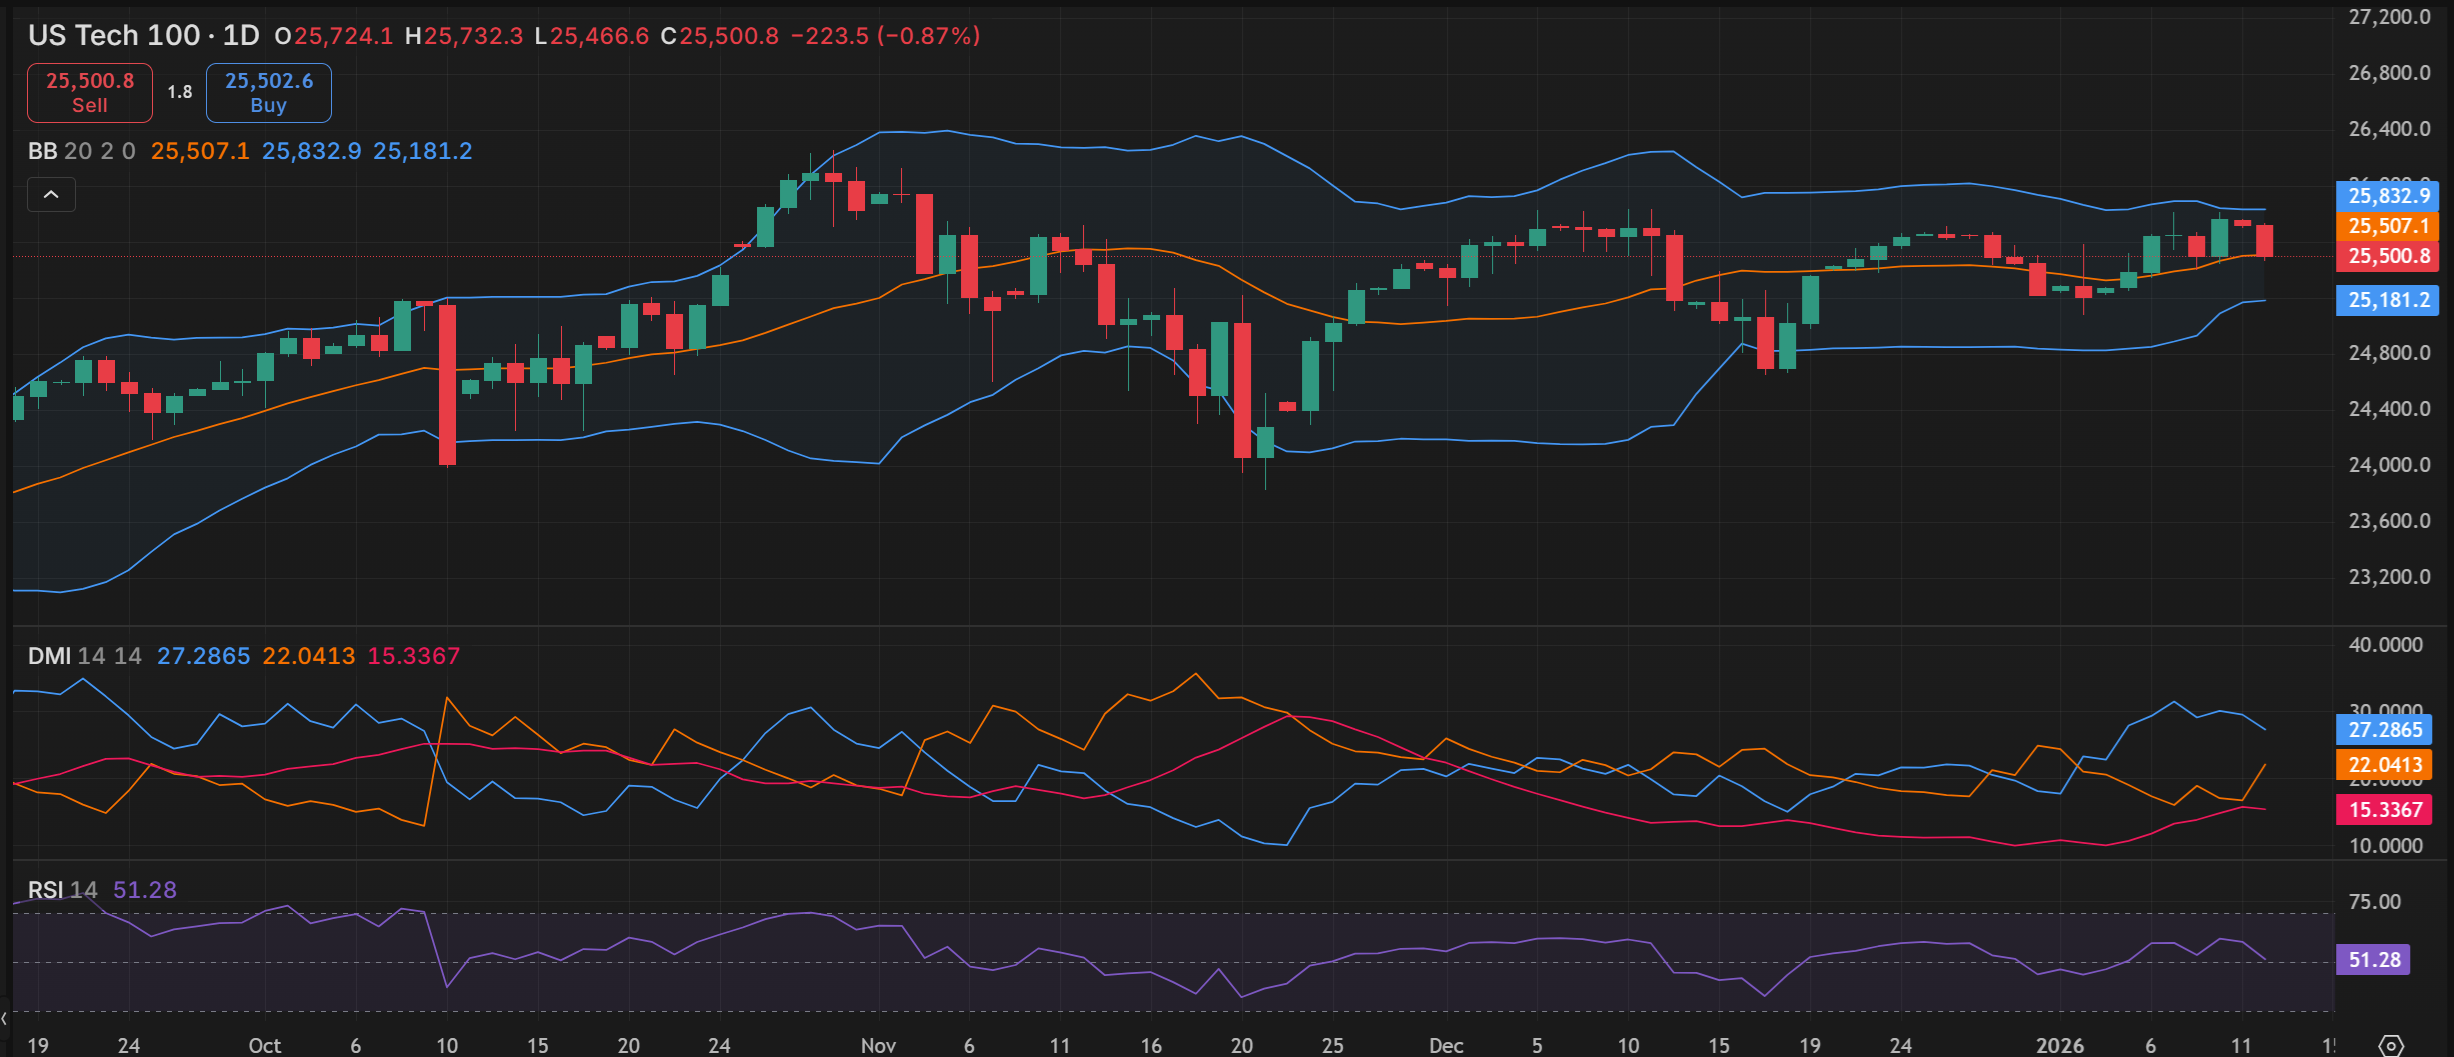
Nasdaq 100’s chart on Capital.com’s platform with key technical indicators
 Source: Capital.com
Period: SEPTEMBER 2025 – JANUARY 2026
Past performance is not an indicator of future results.