Dow Jones Index (US30) forecast: Hormuz tensions lift oil prices
US Wall Street 30 (US30) traded near 46,834 on 12 March 2026 after Strait of Hormuz tensions lifted oil to about $93.62 and US unemployment rose to 4.4%. Past performance is not a reliable indicator of future results. Explore third-party US30 targets and technical analysis.
The Dow Jones Industrial Average index – referred to as the US Wall Street 30 (US30) on CFD trading platforms such as Capital.com – is trading at $46,833.8 as of 2:58pm UTC on 12 March 2026, within an intraday range of $46,816.8–$47,923.4. Past performance is not a reliable indicator of future results.
Pressure on the index has followed escalating tensions in the Strait of Hormuz, with oil trading around $93.62 and the S&P 500 also lower on the day (Reuters, 2 March 2026). A softer US labour market, with the unemployment rate rising to 4.4% in the latest report, has also added to concerns about the pace of economic growth (Yahoo Finance, 6 March 2026). The Dow had already shed approximately 1% in morning trading, extending losses from a week in which US stocks recorded their steepest weekly decline since early August, according to Reuters (Reuters, 6 March 2026).
US Wall Street 30 forecast 2026–2030: Third-party targets
As of 12 March 2026, third-party US Wall Street 30 predictions reflect divergent assumptions around earnings growth, US monetary policy, and technical price cycles.
Long Forecast (monthly cycle model)
Long Forecast places the DJIA at an average of 48,754 in March 2026, within a monthly low–high range of 44,451–52,634, and projects a year-end close of 60,255 by December 2026, with a monthly band of 56,037–64,473. The model derives these targets from long-term price cycles and seasonal patterns, assuming broadly supportive financial conditions with intermittent volatility (Long Forecast, 28 February 2026).
Coin Price Forecast (stepwise algorithmic model)
Coin Price Forecast projects the DJIA reaching 54,082 at mid-year 2026 and a year-end close of 54,651, representing approximately +9% from the index level of 50,116 at the time of the update. The model, which refreshes on a daily basis, derives stepwise targets from extrapolated historical price performance and statistical modelling, with a mid-March 2026 forecast at 51,094 (Coin Price Forecast, 7 February 2026).
LiteFinance (technical range analysis)
LiteFinance projects a March 2026 trading range of 46,200–48,800 for the DJIA, widening to 49,000–54,500 by November 2026. The analysis notes the RSI stood at 68 at the time of writing, flagging a possible minor pullback, with key support at 47,000–46,236 and resistance levels at 50,034, 52,022, and 55,003 (LiteFinance, 4 March 2026).
Predictions and third-party forecasts are inherently uncertain, as they cannot fully account for unexpected market developments. Past performance is not a reliable indicator of future results.
US30 index price: Technical overview
The US30 index trades at $46,833.8 as of 2:58pm UTC on 12 March 2026, sitting below all short- and medium-term moving averages, which can indicate broad selling pressure on the daily timeframe. The 20/50/100/200-day SMAs stand at approximately 48,720 / 49,024 / 48,250 / 46,441, with price currently trading between the 200-day SMA near 46,441 and the 100-day SMA near 48,250, the latter acting as an overhead ceiling.
The 200-day EMA at approximately 46,717 is the nearest dynamic reference below current price. Holding above this level keeps a longer-term structural floor intact, while a close beneath it would place the index under all major moving averages simultaneously. The 200-day SMA at 46,441 converges closely, forming a combined shelf in the 46,441–46,717 zone.
Momentum is weak: the 14-day relative strength index reads 29.66, which sits in oversold territory and may indicate that near-term selling pressure is becoming stretched, though oversold readings alone do not imply a reversal. The average directional index at 25.90 reflects an established trend, which suggests the current downward move carries directional conviction rather than ranging indecision.
On the topside, the classic pivot point at 49,388 represents the first area to reclaim; a convincing daily close above that level would put the R1 resistance near 50,103 back in view, with R2 at 51,227 as the next reference thereafter if momentum improves.
On pullbacks, initial support rests at the 200-day EMA/SMA shelf of 46,717–46,441; losing that zone on a daily closing basis would risk a move toward the S1 pivot near 46,263, with S2 at approximately 45,549 as the next reference if downside pressure persists. The S3 classic pivot at 45,710 represents the outermost downside reference under current data (TradingView, 12 March 2026).
This is technical analysis for informational purposes only and does not constitute financial advice or a recommendation to buy or sell any instrument.
US Wall Street 30 index history (2024–2026)
The US Wall Street 30 index closed at 39,086.8 on 13 March 2024, and broadly held the 39,000–43,000 range through most of 2024, closing the year at 42,509.0 on 31 December 2024 – up roughly 8.8% over that calendar year.
2025 brought sharper swings. The index climbed to a close of 48,066.5 by 31 December 2025, though not without volatility; a pronounced sell-off in April dragged the DJIA to an intraday low of 36,608.5 on 7 April 2025 amid tariff-driven market turbulence, before a sharp recovery carried it back above 48,000 by year-end – a full-year gain of approximately 13.1% from the start of 2025.
The index pushed further into 2026, touching a closing high of 50,268.2 on 10 February 2026 before retreating. A run of consecutive losses through late February and into March erased those gains; as of 12 March 2026, US30 is trading at $46,819.5, down approximately 6.9% from the February closing peak and 2.7% year to date from 1 January 2026, though still 13.0% higher than on the same date one year ago.
Past performance is not a reliable indicator of future results. Share prices are indicative and may differ from live market prices.
US Wall Street 30 (US30): Capital.com analyst view
US Wall Street 30’s performance over the past two years reflects both the resilience and the vulnerability of large-cap US equities to shifting macro conditions. After climbing from the high-$30,000s in early 2024 to a closing peak of $50,268.2 on 10 February 2026, the index has since retreated to around $46,833.8 as of 12 March 2026, a decline of approximately 6.9% from that high. Factors often cited over this period include corporate earnings, expectations around the Federal Reserve’s rate path, and the index’s tilt towards larger, cash-generative companies. However, earnings expectations also carry downside risk if elevated oil prices or tariff-related supply-chain disruption increase costs and pressure margins more than markets currently price in.
The current headwinds are also layered. Escalating Middle East conflict has pushed oil prices higher, which may complicate the Federal Reserve’s path towards rate cuts and raise the risk of stagflation, where tighter financial conditions and weaker consumer spending weigh on the earnings growth that supports index valuations. On the other hand, markets can reprice quickly if geopolitical risks ease or inflation data comes in below expectations, as seen during prior rebounds in 2025 and 2026.
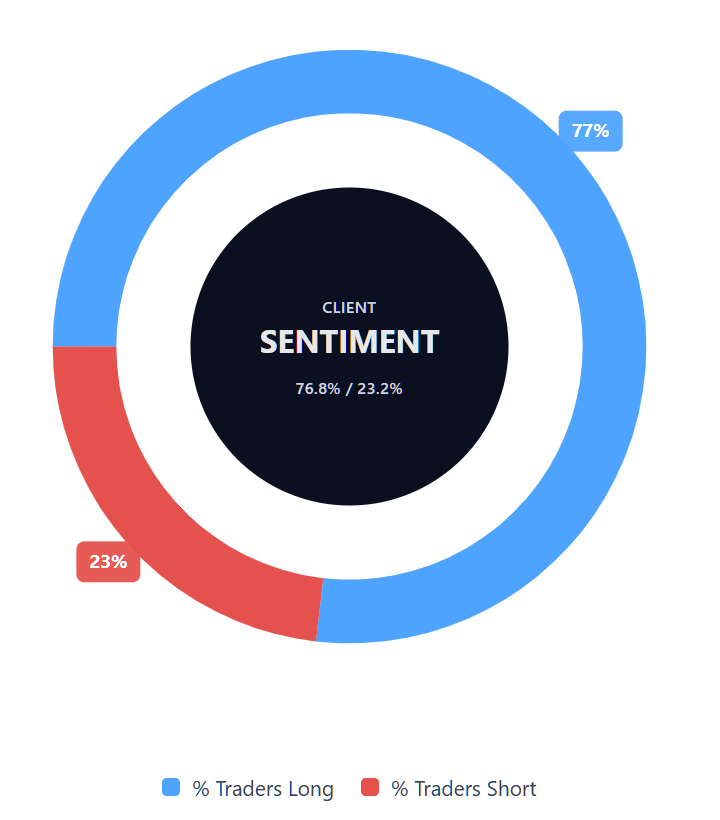
Capital.com’s client sentiment for US Wall Street 30 CFDs
As of 12 March 2026, Capital.com client positioning in US Wall Street 30 CFDs shows 76.8% buyers vs 23.2% sellers, which puts buyers ahead by 53.6 percentage points and places sentiment in heavy-buy, one-sided-towards-longs territory. This snapshot reflects open positions on Capital.com and can change.
Summary – US Wall Street 30 2026
- As of 2:58pm UTC on 12 March 2026, US30 is trading at $46,833.8, down approximately 6.9% from its February 2026 closing peak of $50,268.2. Over the past two years, the index climbed from around $39,086 in March 2024 to a high near $50,268 in February 2026, before the current pullback.
- Technical indicators remain broadly bearish: price trades below all short- and medium-term moving averages, with RSI at 29.66 in oversold territory and ADX indicating an established downtrend. The classic pivot point at 49,388 sits well above current price, while the 200-day SMA/EMA shelf near 46,441–46,717 represents the nearest structural area to watch on the downside.
- Key factors referenced in recent coverage include escalating Middle East conflict and higher oil prices, a weakening US labour market, and uncertainty over the Federal Reserve’s rate path.
Past performance is not a reliable indicator of future results.
FAQ
What is the 5 year US Wall Street 30 forecast?
Third-party providers may publish longer-term projections for US Wall Street 30 (US30), but these are estimates rather than guarantees. In the article, the available third-party models focused on 2026 and showed a wide range of year-end targets, reflecting different assumptions about earnings, US monetary policy and technical cycles. Over five years, uncertainty typically increases, so it’s worth treating any long-range figure as a scenario rather than a single 'expected' outcome.
Is US Wall Street 30 a good CFD to trade?
Whether US30 is 'good' to trade depends on your objectives, timeframe and risk tolerance rather than the index itself. US30 can offer high liquidity and frequent price movement, which some traders use for short-term strategies, but that volatility can also increase losses, especially when using leverage. The article highlights how macro news and geopolitical events can shift sentiment quickly, so risk management tools and a clear plan are important.
Could US Wall Street 30 go up or down?
Yes. US30 can rise or fall based on factors such as corporate earnings, interest-rate expectations, inflation data and geopolitical developments that influence energy prices and growth expectations. The article also notes that technical indicators can highlight areas of momentum, support and resistance, but they do not predict direction with certainty. Prices may move sharply around economic releases, so outcomes can differ from forecasts even when a 'base case' looks plausible.
Should I invest in US Wall Street 30?
This article is for information only and isn’t financial advice. Whether you should invest or trade US30 depends on your personal circumstances, including your experience, financial situation and ability to manage risk. CFDs involve leverage, which can magnify both gains and losses, and you can lose more than your initial deposit depending on your provider’s protections. If you’re unsure, consider getting independent advice and reviewing product disclosures before trading.
Can I trade US Wall Street 30 (US30) CFDs on Capital.com?
Yes, you can trade US Wall Street 30 CFDs on Capital.com. Trading index CFDs lets you speculate on price movements without owning the underlying asset and to take long or short positions. However, contracts for difference (CFDs) are traded on margin, and leverage amplifies both profits and losses. You should ensure you understand how CFD trading works, assess your risk tolerance, and recognise that losses can occur quickly.