S&P 500 index forecast: Iran conflict, CPI, Fed
The S&P 500 Index (US 500) traded near 6,684 on 12 March 2026 as February CPI (2.4% y/y) and Iran-linked oil moves kept March FOMC rate-cut odds low. Past performance is not a reliable indicator of future results. Explore third-party US500 targets and technical analysis.
The S&P 500 index – referred to as the US 500 (US500) on CFD trading platforms such as Capital.com –is trading at $6,683.7 as of 3:14pm UTC on 12 March 2026, within a session range of $6,684.5–$6,814.7. Past performance is not a reliable indicator of future results.
Pressure on the index reflects a confluence of macro and geopolitical factors. Reports of escalating US military involvement linked to the Iran conflict have pushed oil prices higher, which has raised stagflation concerns (Reuters, 8 March 2026). The February CPI report, released on 12 March 2026, confirmed headline inflation held at 2.4% year-on-year and rose 0.3% month-on-month, in line with expectations, while core CPI rose 0.2% for the month (CNBC, 11 March 2026). Strategists have noted that March’s inflation reading – which may capture more of the energy price impact of the Iran conflict – could be more challenging for markets to absorb (MarketWatch, 11 March 2026). The FOMC meeting on 17–18 March 2026 is currently priced at only a 4.7% probability of a rate cut, per CME FedWatch data, which may limit near-term policy relief for equities (CME Group, accessed 12 March 2026).
US 500 forecast 2026–2030: Third-party targets
As of 12 March 2026, third-party US 500 predictions reflect a broadly constructive but increasingly cautious consensus, shaped by divergent assumptions on Federal Reserve policy, earnings growth, US trade policy, and geopolitical risk.
Reuters (strategist poll, year-end target)
A Reuters survey of 44 strategists, analysts, and portfolio managers places the median year-end 2026 target for the S&P 500 at 7,500, representing a gain of approximately 9.7% from the 24 February 2026 closing level of 6,837.75. The survey notes that the constructive outlook rests on solid earnings expectations and steady economic expansion, while a majority of respondents flag a probable near-term correction within three months as a likely reset rather than a trend reversal (Reuters, 24 February 2026).
Investing.com (UBS year-end target)
UBS maintains a year-end 2026 target of 7,700 for the S&P 500, with an interim June 2026 target of 7,300. The bank cites profit growth, a potentially supportive Federal Reserve policy stance, and AI rollout as the primary drivers, forecasting S&P 500 EPS of $310 in 2026, representing 11% growth year-on-year, while noting that historical data shows equities have outperformed when the Fed is easing and recession is avoided (Investing.com, 20 February 2026).
Long Forecast (monthly algorithmic model)
Long Forecast projects the S&P 500 to close March 2026 at 6,545, within a monthly range of 6,081–7,129, before recovering to approximately 7,088 by December 2026, implying a full-year gain of around 3% from the 2026 opening level. The model projects a series of month-on-month declines through mid-year, with April 2026 closing near 6,356 and May 2026 near 6,301, before a gradual recovery builds pace in the fourth quarter, amid elevated near-term volatility assumptions (Long Forecast, 9 March 2026).
Wallet Investor (12-month algorithmic forecast)
Wallet Investor projects S&P 500 futures to reach approximately 7,661 by December 2026, within a full-year monthly range that steps from 6,853 in March 2026 to 7,661 in December 2026, implying a gain of around 12.5% from the January 2026 opening level of 6,680. The model shows a steady month-on-month progression, with June 2026 priced near 7,130 and October 2026 near 7,459, as the algorithm extrapolates prevailing trend momentum (Wallet Investor, 12 March 2026).
Predictions and third-party forecasts are inherently uncertain, as they cannot fully account for unexpected market developments. Past performance is not a reliable indicator of future results.
US500 index price: Technical overview
The US500 index trades at $6,683.7 as of 3:14pm UTC on 12 March 2026, sitting below all short- and medium-term moving averages, with the 20/50/100/200-day SMAs at approximately 6,840 / 6,890 / 6,843 / 6,601 signalling a broadly defensive posture. Every moving average from the 10-day through the 100-day carries a sell signal, while only the 200-day SMA near 6,601 registers a buy, indicating that longer-term structural support remains intact but near-term momentum is firmly to the downside.
The 14-day RSI sits at 35.9, in lower-neutral territory and approaching oversold conditions, while the MACD level at −39.73 and momentum at −228.27 both confirm the prevailing sell bias. The ADX(14) registers 24.75, just below the 25 threshold that would confirm an established trend, suggesting the current downswing carries weight but has not yet shown full directional conviction.
On the topside, the classic pivot point at 6,882.6 marks the first meaningful overhead reference. A daily close back above that level would put the R1 zone near 6,989.8 back in view. A sustained recovery through R1 would then open the path toward the R2 area near 7,100.6.
On pullbacks, the 200-day SMA near 6,601 provides the primary long-term MA shelf below current price. A loss of that level would risk a deeper move toward the S1 classic pivot near 6,771.8 in the interim. S2 near 6,664.6 and the 200-day EMA at approximately 6,592.1 represent successive reference points should selling pressure extend (TradingView, 12 March 2026).
This is technical analysis for informational purposes only and does not constitute financial advice or a recommendation to buy or sell any instrument.
US 500 index history (2024–2026)
The US 500 index closed 2024 at $5,882.7, having gained around 24% across the year, building on a strong recovery from the turbulence of 2022–2023.
The index entered 2025 near $5,884.2 and climbed steadily into mid-February, reaching a peak close of $6,136.6 on 19 February 2025. That momentum reversed sharply in the spring: a broad sell-off through late March and April pushed the index as low as $4,808.4 intraday on 7 April 2025, its deepest point of the period, before a swift recovery carried it back above $6,000 by June. The index then consolidated through the summer, trading in the $6,200–$6,500 range before closing 2025 at $6,848.1.
2026 opened near $6,857.7 and initially held in a tight band, reaching a session high of $7,014.2 on 28 January before fading through February and into March. US 500 (US500) closed at $6,683.5 on 12 March 2026, which is approximately 2.5% down year to date, but around 19.0% up year on year.
Past performance is not a reliable indicator of future results. Share prices are indicative and may differ from live market prices.
US 500 (US500): Capital.com analyst view
The S&P 500’s price trajectory in 2025–2026 has been shaped by a tension between corporate earnings and an increasingly complex macro backdrop. Analysts cited by FactSet project S&P 500 earnings per share growth of around 14–15% for full-year 2026, led by technology at an estimated 32.3%, which has provided a fundamental floor for the index across much of the period. However, those growth forecasts rest on management guidance that has yet to be tested by a full quarter of data, meaning actual results could disappoint if margin pressures from rising energy costs or tariff-driven input inflation materialise.
More recently, geopolitical developments, including conflict in the Middle East and escalating trade policy uncertainty, have introduced headwinds. Higher oil prices following disruptions around the Strait of Hormuz have stoked inflation concerns and pushed back rate-cut expectations, with the CME FedWatch tool pricing a September 2026 pivot as the base case. On the other hand, historical data shows the S&P 500 has, on average, been higher one, three, six, and twelve months after comparable geopolitical shocks, suggesting near-term volatility does not necessarily undermine the medium-term investment case, though that pattern may not repeat given the breadth of current macro pressures.
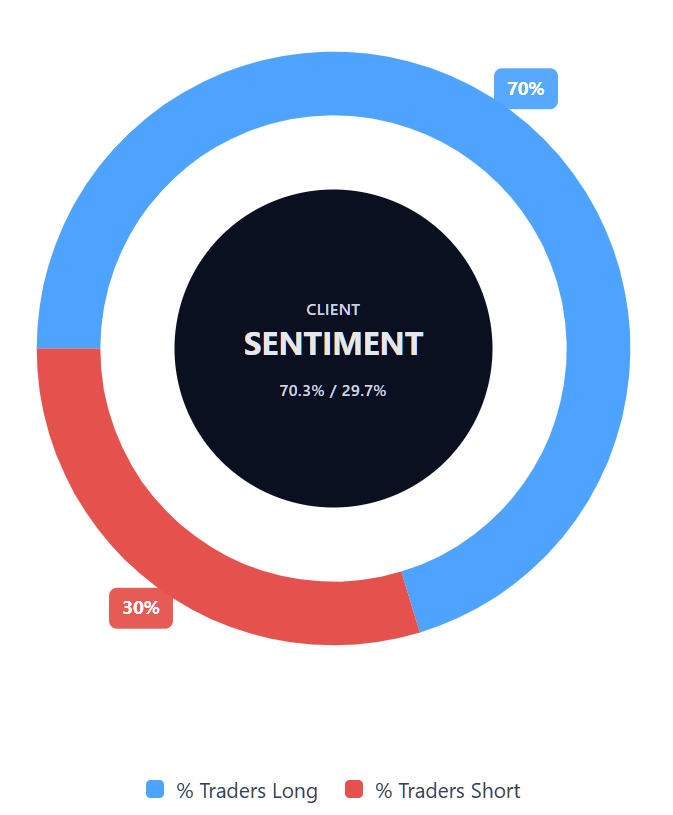
Capital.com’s client sentiment for US 500 CFDs
As of 12 March 2026, Capital.com client positioning in US 500 CFDs shows buyers at 70.3% vs sellers at 29.7%, putting buyers ahead by 40.6 percentage points and placing sentiment firmly in heavy-buy, one-sided-toward-longs territory. This snapshot reflects open positions on Capital.com at the time of capture and can change rapidly as market conditions evolve.
Summary – US 500 2026
- US 500 (US500) trades at $6,683.7 as of 3:14pm UTC on 12 March 2026, down around 2.5% year to date and around 19% up year on year.
- The 14-day RSI sits at 35.9, approaching oversold territory, with MACD and momentum readings confirming the current downside bias.
- Key support sits at the 200-day SMA near $6,601; a recovery above the classic pivot at $6,882.6 would be required to shift the short-term picture.
- February CPI came in at 2.4% year-on-year as expected, but analysts warn March’s reading, which may reflect Iran-conflict energy price effects, may be harder for markets to absorb.
- Middle East geopolitical risk and higher oil prices are weighing on risk appetite, while Federal Reserve rate-cut expectations have been pushed back to September 2026.
Past performance is not a reliable indicator of future results.
FAQ
What is the 5 year US 500 forecast?
Is US 500 a good CFD to trade?
Could US 500 go up or down?
Should I invest in US 500?
Can I trade US 500 CFDs on Capital.com?
Yes, you can trade US 500 CFDs on Capital.com. Trading index CFDs lets you speculate on price movements without owning the underlying asset and to take long or short positions. However, contracts for difference (CFDs) are traded on margin, and leverage amplifies both profits and losses. You should ensure you understand how CFD trading works, assess your risk tolerance, and recognise that losses can occur quickly.