

Nebius stock forecast: Palantir sovereign AI partnership
Nebius Group is an AI infrastructure company. In September 2026, Palantir named Nebius its preferred sovereign AI infrastructure partner. Explore third-party NBIS price targets and technical analysis. Past performance is not a reliable indicator of future results.
Nebius Group N.V. (NBIS) ) is trading at $234.80 as of 10:35am UTC on 10 September 2026, within an intraday range of $233.97–$247.18. Past performance is not a reliable indicator of future results.
The move follows a rally after Palantir named Nebius its preferred sovereign AI infrastructure partner (Yahoo Finance, 9 September 2026). The agreement integrates Nebius's GPU cloud and inference capacity with Palantir's enterprise software, giving eligible commercial customers access to Nebius infrastructure while retaining control over their compute, data and models (Yahoo Finance, 8 September 2026). Truist Financial also initiated coverage (Seeking Alpha, 9 September 2026), while broader reporting highlighted demand for Nebius's Blackwell GPU capacity amid continued focus on AI data-centre power and compute capacity (Yahoo Finance, 8 September 2026).
Third-party Nebius outlook: Palantir deal and capex in focus
As of 10 September 2026, third-party Nebius stock predictions reflect different assumptions around AI infrastructure demand, capacity expansion, earnings and valuation.
DA Davidson
DA Davidson maintains a neutral rating and $250 12-month target. The broker raised its previous target after a data-centre facility received approval, which it cited as a potential contributor to future capacity expansion (GuruFocus, 18 August 2026).
Goldman Sachs
Goldman Sachs raised its Nebius target to $328 from $286 while keeping a buy rating. Analyst Alexander Duval linked the revision to demand trends across the company's AI cloud infrastructure business (TipRanks, 25 August 2026).
Truist Securities
Truist Securities began coverage with a buy rating and $355 target. Its outlook focuses on cloud economics and expectations for continued AI hyperscaler growth, which could support revenue if demand develops as anticipated (Seeking Alpha, 9 September 2026).
MarketBeat
MarketBeat's consensus data puts the average 12-month target at $234.60 across 19 analysts. Individual estimates range from $120–$410, while the moderate-buy consensus incorporates both upward and downward revisions since Nebius reported its second-quarter results (MarketBeat, 9 September 2026).
Investing.com
Across 16 analysts tracked by Investing.com, the average 12-month target stands at $286.69, with estimates spanning $144–$415. Recent revisions reflect differing expectations around infrastructure partnerships, capacity expansion and how quickly investment may translate into growth (Investing.com, 9 September 2026).
Predictions and third-party forecasts are inherently uncertain, as they cannot fully account for unexpected market developments. Past performance is not a reliable indicator of future results.
Nebius (NBIS) latest and upcoming earnings
Nebius Group N.V. published unaudited second-quarter results on 12 August for the period ended 30 June. Group revenue rose 454% year on year to $582.3m from $105.1m. Nebius AI cloud revenue increased 514% to $574.9m, representing 98% of group revenue, while adjusted EBITDA reached $236.2m compared with a $21m loss a year earlier.
Annualised run-rate revenue stood at $3bn at the end of June, up from $1.9bn at the end of March. Management reaffirmed full-year guidance for $3bn–$3.4bn in group revenue, an adjusted EBITDA margin of approximately 40% and capital expenditure of $20bn–$25bn (Nebius, 12 August 2026).
Nebius has not confirmed its next earnings date. MarketBeat estimates that third-quarter results could be published on 10 November 2026 before market open, based on previous reporting schedules (MarketBeat, 13 August 2026). The date remains unconfirmed and may change.
Past performance is not a reliable indicator of future results. Company guidance reflects management's assumptions and may not materialise as expected.
NBIS stock price: technical overview
As of 10:35am UTC on 10 September 2026, the NBIS stock price trades at $234.80, above its 20-, 50-, 100- and 200-day simple moving averages at roughly $229, $213, $211 and $156 respectively. Its 20-day exponential moving average sits near $221, while the 200-day exponential average is further below at around $170, according to TradingView.
The 14-day relative strength index (RSI) stands at 57.16, within neutral territory, while the average directional index (ADX) at 11.12 indicates relatively limited trend strength.
Higher classic pivot references include R1 near $266 and R2 around $326. Below the latest price, the classic pivot near $221 provides a nearby reference, followed by the 50- and 100-day moving averages around $213–$211 and the 200-day simple moving average near $156.
A rise could bring the higher pivot levels into focus, while a move lower could shift attention towards the pivot and moving averages below the current price (TradingView, 10 September 2026).
This is technical analysis for informational purposes only and does not constitute investment advice or a recommendation to buy or sell any instrument.
Nebius share price history (2024–2026)
NBIS’s stock price traded at around $48 in mid-February 2025. Shares fell through the spring, reaching a low near $18 on 21 April before moving higher over the following months.
The stock spent much of mid-2025 below $70 before rising more sharply from August and reaching $109.75 on 8 September. Gains extended into 2026, with shares moving above $130 in March and $260 in June before reaching $299.90 intraday on 22 June.
A pullback followed into July, with the price falling to $141.40 intraday on 29 July before recovering after second-quarter results and subsequent partnership announcements.
Nebius traded at $234.80 as of 10:35am UTC on 10 September 2026, up roughly 160% year to date and around 148% year on year.

Past performance is not a reliable indicator of future results. Share prices are indicative and may differ from live market prices.
Nebius (NBIS): Capital.com analyst view
Nebius shares rose from around $90 to above $290 in June before trading near $234 in September, during a period of rapid revenue growth, capacity expansion and new AI partnerships.
Higher cloud demand, greater capacity utilisation or additional customer commitments could support revenue expectations and sentiment. Conversely, substantial capital expenditure, future funding needs, weaker-than-expected growth or lower AI-sector valuations could weigh on the shares.
The Palantir partnership may broaden demand for Nebius's infrastructure, although its eventual impact will depend on customer adoption and any revenue generated. Together, these factors leave scope for differing views on Nebius's outlook rather than pointing to a single likely price direction.
Capital.com’s client sentiment for Nebius CFDs
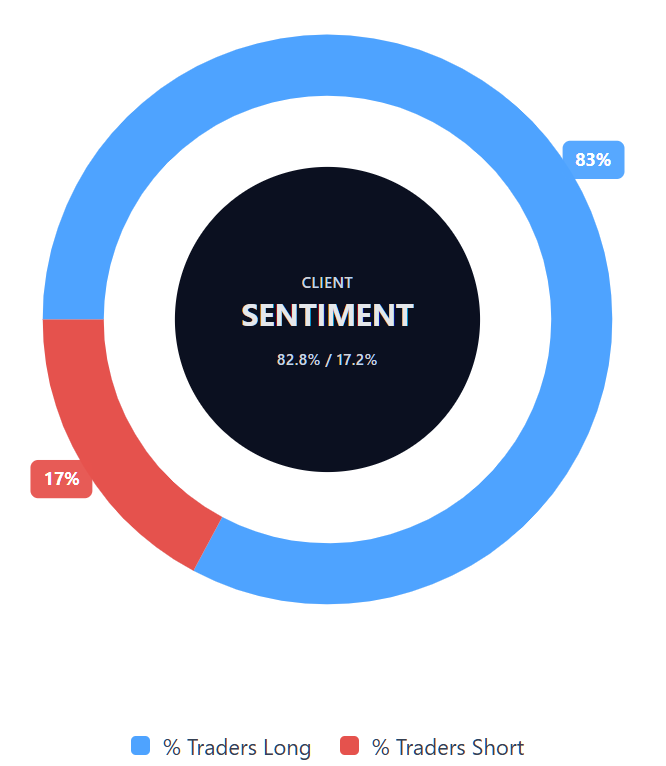
As of 10 September 2026, Capital.com client positioning in Nebius CFDs is weighted towards long positions, with 82.8% long and 17.2% short. This snapshot reflects open positions on Capital.com at the time of measurement rather than future price direction and can change.
Summary – Nebius 2026
- As of 10:35am UTC on 10 September 2026, Nebius traded near $234.80, within an intraday range of $233.97–$247.18.
- The price was above its 20-, 50-, 100- and 200-day moving averages, while RSI at 57.16 remained within neutral territory and ADX at 11.12 indicated limited trend strength.
- Key factors include AI cloud infrastructure demand, second-quarter revenue growth of 454% year on year and the sovereign AI partnership with Palantir.
- Higher demand, capacity utilisation or customer commitments could support sentiment, while capital spending, funding needs or weaker growth could weigh on the shares.
Past performance is not a reliable indicator of future results.
FAQ
Who owns the most Nebius stock?
This article does not identify Nebius's largest shareholder or provide a breakdown of its ownership structure. Instead, it focuses on share-price performance, earnings, AI infrastructure demand, capital expenditure and third-party analyst forecasts. Ownership can change as institutional and other investors adjust their holdings, so current shareholder disclosures would need to be checked separately when assessing which investor holds the largest stake in Nebius.
What is the five-year Nebius share price forecast?
The article does not provide a five-year Nebius stock forecast. The third-party estimates covered here focus on 12-month targets, with named broker targets ranging from $250–$355 and broader individual estimates spanning $120–$415. Longer-term forecasts carry greater uncertainty because AI demand, capacity expansion, funding needs, capital expenditure and valuation can change materially over several years. These figures should therefore be treated as estimates rather than reliable long-term predictions.
Is Nebius a good stock to buy?
This article does not classify Nebius as a good or bad stock to buy. Higher cloud demand, stronger capacity utilisation, new customer commitments or further revenue growth could support sentiment. Conversely, substantial capital expenditure, future funding requirements, weaker growth or lower AI-sector valuations could weigh on the shares. Analyst targets also vary widely, reflecting different assumptions around growth and valuation. These factors provide context but do not amount to an investment recommendation.
Could Nebius stock go up or down?
Yes. Nebius shares can move in either direction as company-specific and wider market conditions change. Higher AI infrastructure demand, capacity growth, stronger earnings or additional customer commitments could support the price. On the other hand, heavy capital spending, funding needs, weaker-than-expected growth or pressure on AI-sector valuations could weigh on it. Technical levels may also influence short-term trading activity, but they are reference points rather than reliable predictions.
Should I invest in Nebius stock?
Whether Nebius shares are suitable for you depends on your circumstances, objectives and tolerance for risk, and this article does not provide investment advice or a personal recommendation. Factors to consider include revenue growth, AI infrastructure demand, capacity expansion, capital expenditure, funding requirements and valuation. Each could influence the share price positively or negatively, while changes in customer demand, financing conditions or the wider AI sector may alter the outlook.
Can I trade Nebius CFDs on Capital.com?
Yes, you can trade Nebius CFDs on Capital.com. Trading share CFDs lets you speculate on price movements without owning the underlying asset and to take long or short positions. However, contracts for difference (CFDs) are traded on margin, and leverage amplifies both profits and losses. You should ensure you understand how CFD trading works, assess your risk tolerance, and recognise that losses can occur quickly.