Amazon stock forecast: Third-party predictions
Amazon (AMZN) was last quoted at $227.93 at 9:19 am UTC on 27 October 2025, trading within an intraday range of $220.24 – $228.12.
Market attention centres on Amazon’s Q3 2025 earnings report due 30 October. The company also announced a €1.4 billion ($1.6 billion) investment in its Dutch operations, reinforcing its logistics expansion across Europe (Reuters, 27 October 2025). Broader sentiment across US megacap tech stocks remains positive as investors consider automation and efficiency measures, including Amazon’s robotics rollout, projected to save up to $4 billion a year in fulfilment costs (Reuters, 15 October 2025).
Amazon stock forecast: Third-party price targets
Yahoo Finance (consensus summary)
Yahoo Finance reported that the consensus analyst target for Amazon rose from $263.74 to $266.56 as sentiment improved across the retail and cloud sectors. The report noted that stronger AWS margins and steady retail performance supported the modest upward adjustment (Yahoo Finance, 6 October 2025).
MarketBeat (consensus tracker)
MarketBeat placed the average 12-month target at $268.69, based on 52 analyst estimates. Its range spans $208 to $315, with a majority ‘buy’ view, indicating stable institutional positioning (MarketBeat, 27 October 2025).
CIBC (broker research)
MarketBeat highlighted CIBC’s increase of Amazon’s target to $315, citing consistent retail demand and solid AWS revenue retention amid steady macroeconomic conditions (MarketBeat, 21 October 2025).
Goldman Sachs (investment-bank note)
Investing.com confirmed that Goldman Sachs raised its Amazon target from $240 to $275, maintaining a Buy rating. The revision followed updated AWS growth forecasts, with the bank citing AI-driven adoption and improved capital efficiency as key factors (Investing.com, 3 October 2025).
Benchmark (research reiteration)
MarketBeat reported that Benchmark reaffirmed its Buy rating with a $260 target, highlighting better cloud utilisation and growing advertising revenue ahead of the Q3 earnings cycle (MarketBeat, 22 October 2025).
Past performance and third-party forecasts are not reliable indicators of future results. Trading in leveraged products such as CFDs carries a high risk of loss due to leverage. You should consider whether you understand how CFDs work and whether you can afford to take that risk.
Daniela Hathorn – Capital.com analyst view
Capital.com analyst Daniela Hathorn says Amazon’s upcoming Q3 2025 results, due on 30 October, are likely to focus on four key areas: Amazon Web Services (AWS), advertising, margins, and capital expenditure (Capex).
Advertising remains a bright spot, up around 22% year on year last quarter, supported by Prime Video’s growth. The market will be looking for that momentum to continue through the holiday period.
In retail, attention is on North America and International operating margins, which have been improving as logistics efficiency builds. Any guidance suggesting that progress will continue would likely be viewed positively.
Finally, on AI and Capex, Amazon continues to invest heavily in data centres and custom silicon, with 2025 spend tracking at a significant level. Investors will want to see when that investment begins to feed through to revenue and free cash flow.
Overall, AWS trajectory, ad strength and margin visibility could be the key drivers for the share price next week.'
AMZN stock price: Technical overview
Amazon (AMZN) last traded at $227.93 at 9:19am UTC on 27 October 2025. The daily simple moving average (SMA) cluster sits near 219.9 / 225.1 / 222.9 / 214.2 for the 20-, 50-, 100- and 200-day periods, with the 20-over-50 alignment remaining intact. The 10- and 20-day exponential moving averages (EMAs) are both above 219.8, indicating a mild upward bias during the session.
Momentum is broadly neutral, with RSI(14) at 53.7. The short-term trend appears weak, with ADX(14) at 16.4, while broader oscillators suggest a balanced setup. Initial resistance sits near the Classic R1 pivot at 233.5, followed by 247.3. Initial support is at the Classic Pivot, 225.0, with the 200-day SMA around 214.2. A close above R1 may open the way to higher resistance levels, while a drop below the 200-day SMA could bring lower pivots into focus (TradingView, 27 October 2025).
This analysis is for informational purposes only and does not constitute financial advice or a recommendation to buy or sell any instrument.
Amazon share price history
Amazon’s share price has risen steadily over the past two years, moving from $132.42 on 30 October 2023 to $227.96 on 27 October 2025 – an increase of about 72%. The stock gained momentum through 2024 and into 2025 as consistent quarterly results and stable cloud revenues helped offset broader market volatility.
Year on year, Amazon closed at $187.72 at the end of October 2024, marking a rise of around 21% over the past twelve months. The two-year trend shows a measured recovery from its 2023 base, supported by resilient performance and steady investor confidence. Amazon last closed at $223.90 on 26 October 2025.
Past performance is not a reliable indicator of future results. Share prices are indicative and may differ from live market prices.
Capital.com’s client sentiment for Amazon CFDs
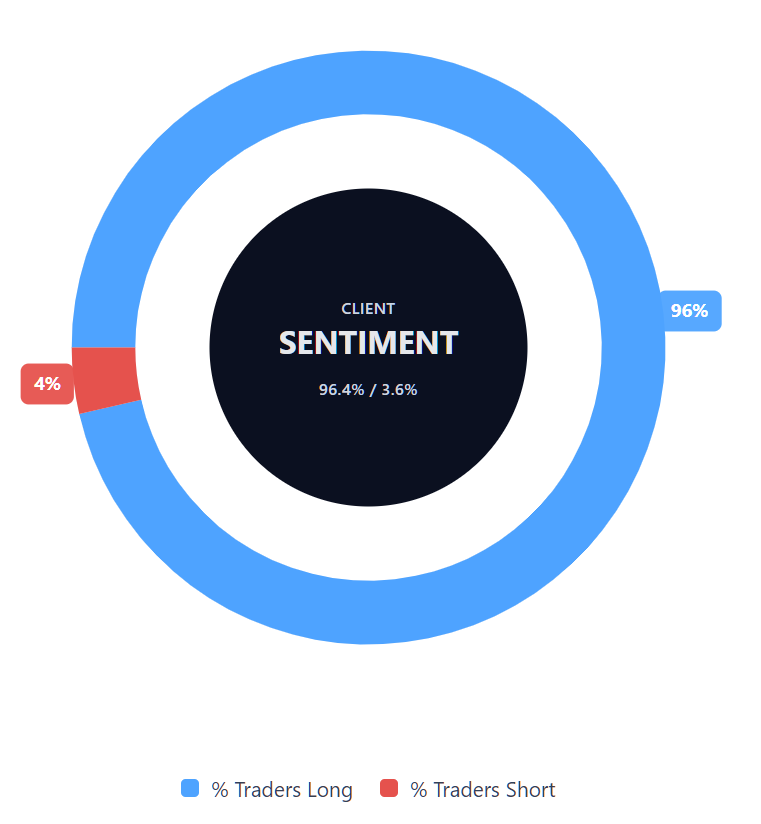
As of 27 October 2025, Capital.com client sentiment for Amazon (AMZN) shows 96.4% of positions held long and 3.6% short, giving a net long difference of 92.8 percentage points. The imbalance indicates a prevailing preference for long exposure among Capital.com traders, though sentiment may shift as market conditions change.
FAQ
Is Amazon a good stock to buy?
Amazon has reported steady revenue growth in recent years, supported by its e-commerce and cloud segments. However, whether it’s suitable to buy or trade depends on individual strategy, market conditions and risk tolerance. Always conduct your own analysis and ensure you understand the risks before trading Amazon CFDs. Contracts for difference (CFDs) are traded on margin – leverage amplifies both profits and losses.
Could Amazon stock go up or down?
Should I invest in Amazon stock?
Deciding whether to invest in or trade Amazon shares depends on your goals, trading approach and risk appetite. CFD trading involves leverage and carries a high level of risk. Consider whether you understand how CFDs work and whether you can afford to take that risk.
What can influence Amazon’s share price?
Amazon’s share price is influenced by factors such as cloud division (AWS) performance, retail sales trends, and wider movements in the technology sector. Broader economic conditions, investor sentiment and company guidance can also impact short-term price movements. Past performance is not a reliable indicator of future results.