Accenture stock forecast: Third-party price targets
Track the latest Accenture stock predictions, analyst targets, technical overview and client sentiment.
Accenture (ACN) is trading at $242.40 as of 2.47pm UTC on 22 September 2025, sitting just below its intraday high of $242.44 and well above the session low of $235.25.
Market tone is subdued as US stock index futures edged lower – Dow futures down 0.32% and S&P 500 futures 0.29% lower – following last week’s record highs. The decline comes amid uncertainty over newly announced H-1B visa fees and ahead of scheduled Federal Reserve speeches(Reuters, 22 September 2025).
Accenture share price forecast: Analyst outlook
J.P. Morgan (IT services outlook)
J.P. Morgan sets a $302 price target for ACN, reflecting an Overweight rating. The bank highlights the need for IT services growth to recover, with third-quarter bookings that, while solid, show sector-wide signs of deceleration (Yahoo Finance, 28 August 2025).
Guggenheim (fiscal Q1 outlook)
Guggenheim lowers its target to $305, maintaining a Neutral stance. The firm points to fiscal Q1 2026 revenue concerns after a mix of large and mid-market contract wins came in slightly below expectations (Investing.com, 17 September 2025).
Morgan Stanley (services demand)
Morgan Stanley’s James Faucette affirms a $325 target, keeping a Hold rating. He cites steady Managed Services demand supporting consistent revenue flows amid constrained discretionary spending in consulting (Yahoo Finance, 18 August 2025).
Morgan Stanley (contract duration)
Morgan Stanley trims its target to $340, retaining an Equal-weight rating. It notes that longer-duration deal conversions help cushion Accenture against broader macroeconomic softness in technology consulting (Investing.com, 12 June 2025).
CFDs are complex instruments and come with a high risk of losing money rapidly due to leverage.
ACN stock price: Technical overview
On the daily chart, ACN trades at $242.40 as of 2.47pm UTC on 22 September 2025, holding above its key moving-average cluster – 20/50/100/200-day moving averages at approximately 249, 257, 283 and 313. The 14-day RSI is 39.4, signalling neutrality, consistent with a sideways bias while the price remains near the MA band. On the topside, a daily close above 253.92 would open 271.16, while a loss of the 242.72 pivot would expose 225.48 (TradingView, 22 September 2025).
This is technical analysis for informational purposes only and does not constitute financial advice or a recommendation to buy or sell any instrument.
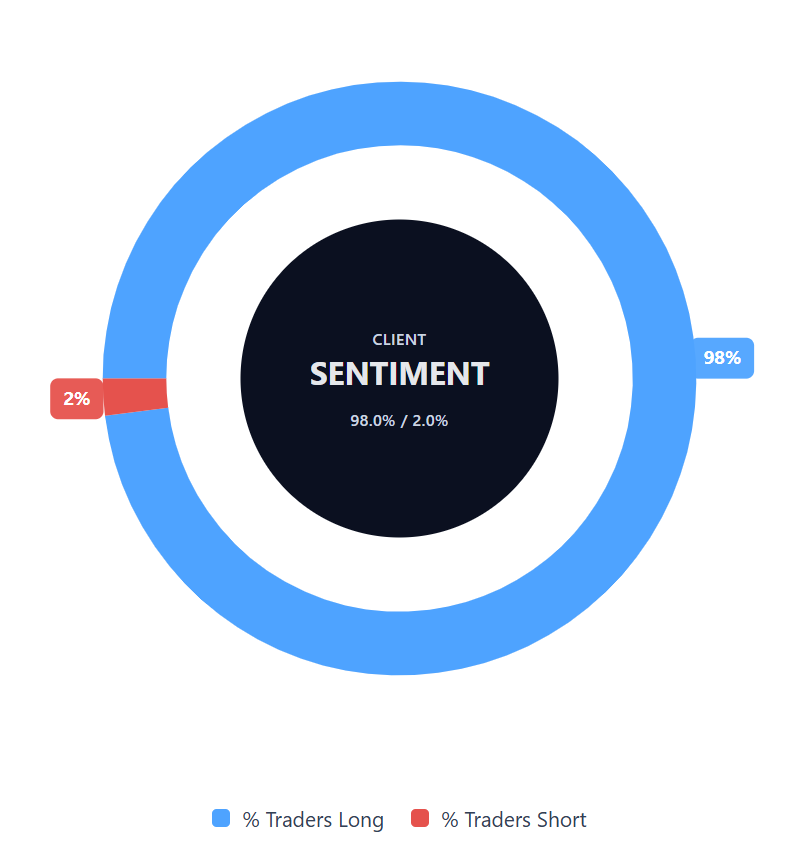
Capital.com’s client sentiment for Accenture CFDs
Accenture CFD buyers account for 98% of positions, compared with 2% for sellers, leaving buyers ahead by 96 percentage points (22 September 2025). This places sentiment in heavily long territory. The snapshot reflects open positions on Capital.com and is subject to change.
FAQ
Who owns the most Accenture stock?
According to the latest regulatory filings, the largest institutional shareholders are Vanguard Group (about 9.57%) and BlackRock (around 7.81%) of outstanding shares (Yahoo Finance, 22 September 2025).
Is Accenture a good stock to buy?
This content is for informational purposes only and does not constitute financial advice or a recommendation to trade any security.
Could Accenture stock rise or fall?
Like any equity, Accenture’s share price can fluctuate in response to market conditions, company performance and macroeconomic factors. Past performance is not a reliable guide to future results.
Should I trade Accenture stock?
Decisions about trading should be based on your individual objectives, risk tolerance and circumstances. You should consider seeking advice from a qualified financial professional before trading contracts for difference (CFDs). CFDs are traded on margin, and leverage can amplify both your gains and losses.