Thyssenkrupp stock forecast: Third-party price targets
Thyssenkrupp’s share price has moved through a period of significant change in recent years, shaped by restructuring activity, shifting industrial conditions and updates across its broader portfolio.
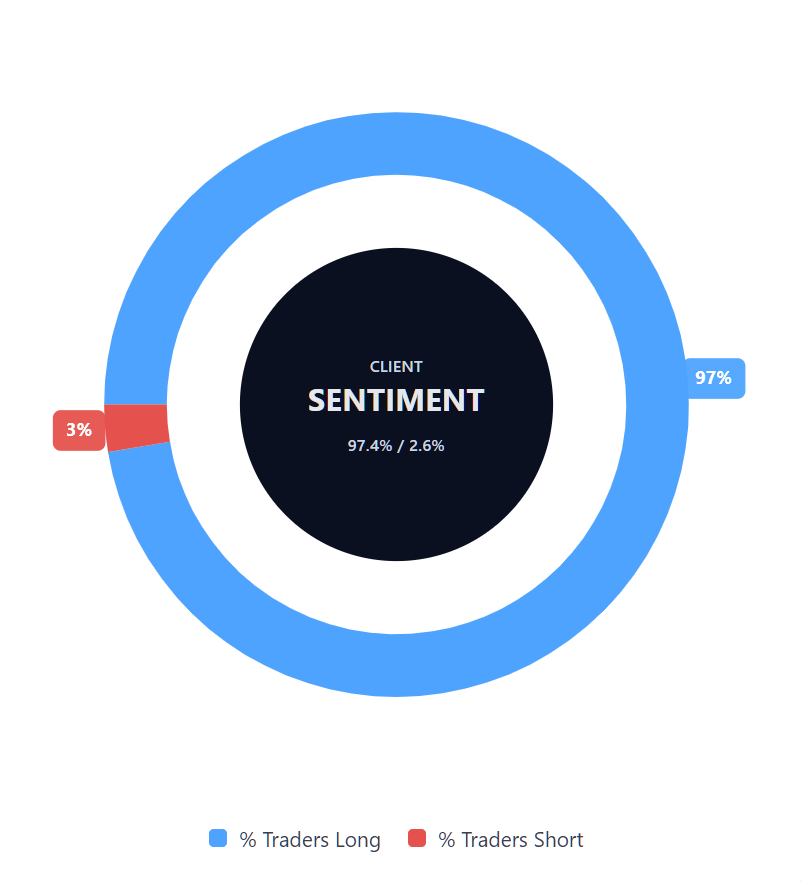
Thyssenkrupp (TKA) is trading around €9.03 as of 1:22pm UTC on 3 December 2025, moving within an intraday range of €8.96–9.75 on Capital.com’s share CFD feed, with buyers accounting for about 97% of current client sentiment and sellers about 3%.
The stock is trading against a backdrop of a major restructuring of the group’s steel division, where management and unions have agreed plans to cut or outsource about 11,000 jobs and reduce production capacity, with the agreement financed and scheduled to run until 2030 (Reuters, 1 December 2025). Trading also takes place as broader German equities hold steady, with Germany’s main stock market index around the mid-23,000s in early December (Trading Economics, 3 December 2025).
Past performance is not a reliable indicator of future results.
Thyssenkrupp stock forecast 2026–2030: Analyst price targets
As of 3 December 2025, third-party Thyssenkrupp price forecasts show a wide range of external views on the stock as the group continues to restructure and streamline its portfolio. These third-party figures are based on each institution’s own models and assumptions and can change as forecasts are updated.
MarketScreener (consensus)
MarketScreener reports that the average target price for Thyssenkrupp stands around €9.74, based on a sample of nine analysts, versus a spot level close to €9 at the time. The service notes an overall 'hold' stance, with the modest implied upside reflecting a balance between progress on restructuring and ongoing cyclical, operational and execution-related risks (MarketScreener, 27 November 2025).
Kepler Cheuvreux (broker target)
Kepler Cheuvreux, in a note published in October 2025, lifted its target price for Thyssenkrupp shares to €13.80 from €13.40, while retaining a positive rating. The broker cites the stock market debut and valuation of Thyssenkrupp Marine Systems, alongside updated assumptions on steel financing, peer comparisons and net debt in its sum-of-the-parts approach (Investing.com, 21 October 2025).
MarketWatch (broker move summary)
A MarketWatch page summarises broker activity on Thyssenkrupp, including one house raising its objective from the low-€6 area into the mid-€7s. The article explains that the higher marker accompanies adjustments to the analyst’s view of the steel business outlook and management actions, while still flagging the uncertainties around the wider transformation (MarketWatch, 31 October 2025).
Thyssenkrupp IR (analyst estimates context)
Thyssenkrupp’s own analyst estimates page, updated for the 2024/2025 and 2025/2026 financial years, aggregates external projections for sales, adjusted EBIT and free cash flow but does not provide an internal price target. The company emphasises that these consensus figures are produced independently by covering analysts and sit against a backdrop of cost-cutting, portfolio measures and capital allocation decisions that could affect how targets evolve over time (Thyssenkrupp, accessed 3 December 2025).
Predictions and third-party forecasts are inherently uncertain, as they cannot fully account for unexpected market developments. Past performance is not a reliable indicator of future results.
TKA stock price: Technical overview
TKA is trading near €9.03 as of 1:22pm UTC on 3 December 2025, holding close to the classic pivot at 9.09 after an intraday range between 8.96 and 9.75 on Capital.com’s feed. The simple moving-average cluster on the daily chart is relatively flat, with the 20/50/100/200-day SMAs grouped around roughly 9.16, 8.92, 7.87 and 7.04. This leaves price slightly above several medium- and long-term reference levels, while the 10-day SMA near 9.07 and short-term Hull moving average around 9.48 sit somewhat higher in the very near term.
The 14-day RSI around 50.5 is neutral, and an ADX reading near 14 suggests a weakly defined trend, with other oscillators mixed between neutral and mildly negative. With price sitting just below the classic R1 level at 9.90, a daily close above that area would put the R2 region around 10.38 back in view, while on the downside the classic pivot at 9.09 marks initial support ahead of the 100-day SMA shelf near 7.87. A clear, sustained break below that longer-term average would risk a move toward the S1 area around 8.61 within the broader 2025 range (TradingView, 3 December 2025).
This is technical analysis for informational purposes only and does not constitute financial advice or a recommendation to buy or sell any instrument.
Thyssenkrupp share price history
Thyssenkrupp AG’s stock price has experienced significant volatility over the last two years, moving from around €3.90 at the close on 3 December 2024 to about €9.07 on 3 December 2025. Over much of 2024 the stock oscillated between roughly €3.10 and €4.70, spending late 2024 in the mid-€3s before gradually rising into the new year.
In 2025 the move accelerated: TKA started January just above €4.00, dipped briefly back towards that level, then trended higher through the spring and summer, breaking above €10 in May and July and briefly spiking above €13 in October before pulling back into single digits. By early December 2025, recent closes are clustered around €9.00 on Capital.com’s pricing, leaving the stock more than doubled year on year but still showing marked intra-year swings.
Past performance is not a reliable indicator of future results. Share prices are indicative and may differ from live market prices.
Capital.com analyst view
Thyssenkrupp AG stock price movements in 2025 has been marked by strong gains and sharp swings, climbing from the low single digits in early January to trade around €9.03 as of 1:22pm UTC on 3 December 2025 on Capital.com’s platform, with a brief overshoot above €13 in October. That path reflects a shift from a relatively range-bound 2024 into a more volatile 2025, as the market reacted to earnings, portfolio updates and sector news.
From a fundamental perspective, the late-2025 price level sits against a challenging industrial backdrop in which Thyssenkrupp has reported mixed performance, fine-tuned guidance and moved ahead with a deep restructuring of its steel operations involving about 11,000 job cuts or outsourced roles and corresponding capacity reductions. These measures, together with sentiment around leverage, capital allocation and exposure to the German and global cycle, help indicate why the share has tended to move in bursts rather than smoothly, as investors reassess both execution risk and potential operational benefits over time.
Capital.com’s client sentiment for Thyssenkrupp CFDs
As of 3 December 2025, Capital.com client positioning in Thyssenkrupp (TKA) CFDs is one-sided toward longs: 97.4% buyers vs 2.7% sellers, which puts buyers ahead by 94.7 percentage points. This reflects a heavy-buy skew rather than a broadly balanced market, and may change as positions are opened and closed.
Summary – Thyssenkrupp price 2025
- Thyssenkrupp’s TKA share trades around €9.03 as of 1:22pm UTC on 3 December 2025, after an intraday range between €8.96 and €9.75 on Capital.com’s platform.
- Over the past year the stock has more than doubled, rising from around €3.90 in early December 2024 and briefly moving above €13.00 in October 2025 before easing back into single digits.
- Price action in 2025 has been volatile, with notable moves around news on portfolio measures and a major steel restructuring that will cut or outsource about 11,000 jobs and reduce production capacity over several years.
- Daily technicals show TKA trading near its short-term pivot at €9.09, with the 20/50/100/200-day SMAs clustered around roughly 9.16, 8.92, 7.87 and 7.04. The 14-day RSI near 50 signals neutral momentum and a weakly defined trend.
- Capital.com’s client sentiment is heavily skewed to the upside, with about 97.35% of open Thyssenkrupp CFD positions held by buyers and 2.65% by sellers, leaving buyers more than 90 percentage points ahead.
Past performance is not a reliable indicator of future results.
FAQ
Who owns the most Thyssenkrupp stock?
Thyssenkrupp’s shareholder base includes a mix of institutional investors, strategic holders and retail shareholders. While specific ownership levels shift over time, the company’s largest stakes are typically held by long-term institutions and entities with an interest in the group’s industrial operations. Public disclosures from the company and regulatory filings offer the clearest view of current ownership, as holdings can change with market activity and corporate actions.
What is the 5-year forecast for Thyssenkrupp stock?
There’s no single, definitive 5-year forecast for Thyssenkrupp, as analysts’ long-term expectations differ based on their assumptions around restructuring progress, industrial demand, capital allocation and macroeconomic conditions. Forecasts visible today represent third-party models that may change as new information emerges, and they cannot account for unexpected market or operational developments. Long-term projections should always be viewed as indicative rather than fixed or predictive.
Is Thyssenkrupp a good stock to buy?
Whether Thyssenkrupp is considered a good investment depends on each trader’s objectives, risk tolerance and view of the company’s multi-year restructuring. The stock has experienced significant volatility, including sharp moves around news on portfolio measures and developments in its steel division. Any assessment of its suitability will hinge on independent research and an understanding of both the potential opportunities and the risks associated with cyclical industrial businesses. This is not financial advice and should not be taken as a recommendation.
Could Thyssenkrupp stock go up or down?
Yes, Thyssenkrupp’s share price may move in either direction, reflecting changes in earnings, restructuring execution, sector conditions and broader market sentiment. Technical indicators in late 2025 show a neutral trend, while analyst targets span a wide range from under €10 to about €13.80. Future price movements are uncertain, and no analysis can guarantee whether the stock will rise or fall over any time frame. Past performance is not a reliable indicator of future results.
Should I invest in Thyssenkrupp stock?
Only you can determine whether an investment aligns with your financial situation and appetite for risk. The company is undergoing a large-scale transformation, which introduces both potential benefits and meaningful uncertainties. Traders should consider the volatility shown in recent years, the multi-year restructuring in the steel division and the external factors that influence industrial markets, and then make an independent decision based on their own analysis. This is not financial advice and does not constitute a recommendation.
How can I trade Thyssenkrupp CFDs on Capital.com?
You can trade Thyssenkrupp share CFDs on Capital.com by opening an account, completing verification and searching for 'Thyssenkrupp' or 'TKA' on the platform. This gives you the ability to go long or short using CFDs (contracts for difference). CFDs are traded on margin, and leverage amplifies both profits and losses.