BYD Company stock forecast: Third-party price targets
BYD Company is a Hong Kong–listed automotive manufacturer focused on electric vehicles and plug-in hybrids, with operations covering vehicle production, batteries and related technologies across domestic and overseas markets. Explore third-party 1211 price targets and technical analysis.
BYD Company Limited (1211) is trading around $97.85 HKD as of 4:11pm UTC on 30 January 2026, within an intraday range of $97.50–$101.85 HKD on Capital.com’s feed, after the stock most recently closed near $97.75 HKD on the Hong Kong exchange and remains about 10% above its 52-week low near $88.67 HKD.
Price action comes amid a softer Hong Kong equity session, with Hong Kong’s main stock market index falling by just over 2% on 30 January 2026 after strong gains earlier in the month, while recent data show the Hang Seng up about 6.8% month to date and more than 35% year on year (Morningstar, 30 January 2026). On the company side, BYD has remained in focus following ongoing product updates in its plug-in hybrid and electric vehicle lines, alongside continued headlines around overseas expansion (CarNewsChina.com, 31 October 2025).
BYD Company stock forecast 2026–2030: Third-party price targets
As of 30 January 2026, third-party BYD Company stock predictions tend to cluster around one-year targets above the current spot level, using 12-month horizons and consensus inputs from multiple brokers. The figures below summarise selected third-party targets, focusing on headline price levels, timeframes and stated assumptions available as of their respective publication dates.
Moomoo (broker forecast summary)
Moomoo’s 1211 stock forecast page indicates an average 12-month stock price target of about $280.47 HKD, with a maximum estimate near $458.80 HKD and a minimum closer to $140 HKD. The broker notes that these targets are based on contributing analysts’ expectations for earnings, sales and margin performance over the coming year, amid ongoing discussion of EV sector growth and competition (Moomoo, 29 January 2026).
StocksGuide (analyst target dashboard)
StocksGuide’s BYD target-price module reports an average analyst target of about $132.87 HKD, based on 26 estimates, with a high around $174.02 HKD and a low near $93.40 HKD. The service says these figures reflect aggregated expectations for 2026–2027 sales, earnings and margins, amid assumptions of continued revenue growth and EV demand (StocksGuide, 8 January 2026).
Simply Wall St (valuation check)
A Simply Wall St valuation article notes that BYD was trading near $102.80 HKD, alongside fair-value and analyst price-target estimates that sit higher, based on discounted cash flow modelling and consensus inputs. The note suggests that this gap illustrates a level the share price could move towards if sentiment or earnings expectations change, while also referencing a price-to-earnings multiple of around 21.7 times (Simply Wall St, )28 January 2026.
Predictions and third-party forecasts are inherently uncertain, as they cannot fully account for unexpected market developments. Past performance is not a reliable indicator of future results.
1211 stock price: Technical overview
The 1211 stock price is trading around $97.85 HKD as of 4:11pm UTC on 30 January 2026, holding just above the classic pivot near 96.6 and below the first resistance (R1) around 100.7. The simple moving-average cluster on the daily chart is relatively compressed, with the 20-, 50-, 100- and 200-day moving averages at roughly 98, 97, 101 and 113, leaving the price slightly below short- and medium-term reference levels while still within reach of the 50-day area.
The 14-day RSI, around 48.7, sits in mid-range neutral territory, while the ADX near 16 points to a modestly developed trend backdrop. A move through the 100.7–105.9 area defined by R1 and R2 on a closing basis would bring the 110–115 zone back into view, where R3 and the 200-day SMA converge as a broader topside reference. On the downside, the pivot near 96.6 marks initial support, with S1 near 91.3 representing the next notable level if the price moves decisively away from the pivot region (TradingView, 30 January 2026).
This technical analysis is for informational purposes only and does not constitute financial advice or a recommendation to buy or sell any instrument.
BYD Company share price history (2024–2026)
1211’s stock price has seen a sharp reset over the past two years, moving from levels above $400 HKD in mid-2025 to below $100 HKD by the end of January 2026. The stock closed at $465.30 HKD on 23 May 2025 before peaking again in early June, then declined steadily through the second half of 2025, finishing the year at $95.25 HKD on 31 December 2025.
In 2024, the picture was markedly different. BYD traded mostly within a higher $200–$300 HKD range, ending that year at $267.30 HKD on 31 December 2024 before early-2025 volatility pushed the price above $400 HKD and back down again. As of 30 January 2026, the share price stands at $97.85 HKD, leaving it well below its 2024 closing level and significantly below the mid-2025 highs.
Past performance is not a reliable indicator of future results. Share prices are indicative and may differ from live market prices.
BYD Company (1211): Capital.com analyst view
BYD Company’s share price has moved from the mid-$200 HKD area in late 2024 to below $100 HKD by 30 January 2026, reflecting a sharp re-rating after an extended rally that pushed the stock above $400 HKD in May–June 2025. This swing illustrates how quickly sentiment around electric vehicle makers can change as market participants respond to evolving growth expectations, sector competition and broader risk appetite, with recent intraday prices clustered within a relatively tight $90–$105 HKD range.
On the supportive side, BYD remains a major global EV and plug-in hybrid player, and periods of improved risk sentiment or renewed interest in EV adoption may underpin demand for the stock. At the same time, concerns around margins, policy support or demand can weigh on valuations and keep prices under pressure, particularly after phases of rapid growth. Short-term momentum and technical levels can also influence price behaviour, potentially reinforcing both rallies and pullbacks as the market reacts to prior highs and lows.
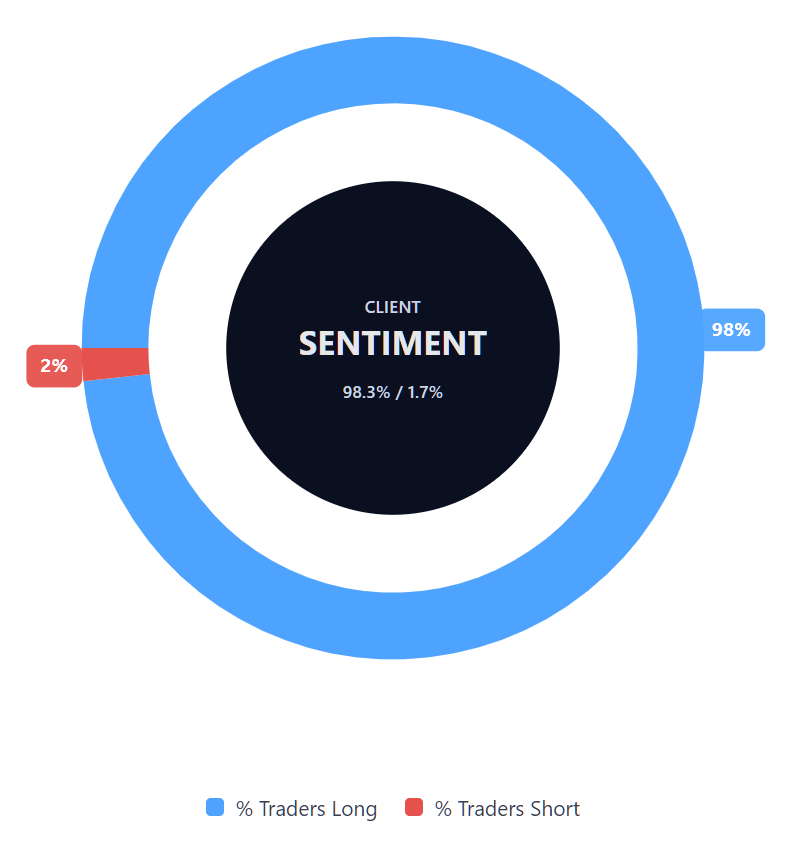
Capital.com’s client sentiment for BYD Company CFDs
As of 30 January 2026, Capital.com client positioning in BYD Company CFDs shows 98.3% buyers versus 1.7% sellers, which indicates a heavy-buy, one-sided tilt toward longs and puts buyers ahead by about 96.7 percentage points. This snapshot reflects open positions on Capital.com and can change.
Summary – BYD Company 2026
- BYD Company (1211) is quoted on Capital.com as a stock CFD in HKD, last trading at $97.85 HKD as of 4:11pm UTC on 30 January 2026.
- Over the past two years, the share price has moved from the $200–$300 HKD range in late 2024 to highs above $400 HKD in May–June 2025, before retreating to below $100 HKD by the end of 2025.
- During 2025, price action featured a sharp rally into late May and early June, followed by a prolonged decline, with BYD closing the year at $95.25 HKD on 31 December 2025.
- Technical indicators show the price trading just above the main daily pivot, with clustered moving averages around the high-$90s to low-$100s HKD. The 14-day RSI sits in neutral territory, while the ADX points to a modest underlying trend.
- Key drivers for sentiment include BYD’s position in the global EV and plug-in hybrid market, shifting expectations for growth and margins, and broader developments across China’s automotive and equity markets.
Past performance is not a reliable indicator of future results.
FAQ
Who owns the most BYD Group stock?
BYD Company has a diversified ownership structure, with significant stakes held by its founder and chairman, Wang Chuanfu, alongside institutional and strategic investors. One of the most notable shareholders is Berkshire Hathaway, which has historically held a sizeable position through its subsidiary. Over time, shareholdings can change due to market transactions, regulatory disclosures and portfolio adjustments, meaning current ownership levels may differ from earlier filings.
What is the five-year BYD Group share price forecast?
There is no single, widely agreed five-year 1211 stock forecast. Most publicly available projections focus on shorter horizons, typically around 12 months, and are based on differing assumptions about growth, margins and industry conditions. Longer-term forecasts are generally more speculative, as they depend on factors such as technological development, competition, policy changes and global demand, all of which can shift materially over time.
Is BYD Group a good stock to buy?
Whether BYD Group is considered a “good” stock depends on an individual’s objectives, risk tolerance and market outlook. The company operates in a competitive and rapidly evolving sector, which can present both potential opportunities and risks. Analyst opinions and price targets vary, reflecting different views on future performance. This information is provided for general market context only and does not constitute investment advice.
Could BYD Group stock go up or down?
Like all listed shares, BYD Group’s stock price can move both up and down. Price changes may reflect company-specific developments, broader equity market conditions, shifts in investor sentiment and external factors affecting the electric vehicle sector. Volatility can also increase around earnings releases, policy announcements or changes in growth expectations. Past price movements do not reliably predict future performance.
Should I invest in BYD Group stock?
Deciding whether to invest in BYD Group stock is a personal decision that depends on your financial circumstances, objectives and understanding of the risks involved. Share prices can fluctuate, and losses are possible. This content does not provide investment advice or recommendations. You may wish to consider a range of information sources and, where appropriate, seek independent financial advice before making any investment decisions.
Can I trade BYD Group CFDs on Capital.com?
Yes, you can trade BYD Company CFDs on Capital.com. Trading share CFDs lets you speculate on price movements without owning the underlying asset and to take long or short positions. However, contracts for difference (CFDs) are traded on margin, and leverage amplifies both profits and losses. You should ensure you understand how CFD trading works, assess your risk tolerance, and recognise that losses can occur quickly.