Berkshire Hathaway stock forecast: Third-party price targets
Berkshire Hathaway is one of the most closely followed companies in global equity markets, reflecting its size, diversified business model and long-standing investment approach. Explore BRK’s recent price action, third-party price targets and technical analysis.
Berkshire Hathaway (BRK.B) is trading around $497.88 in early European hours on 13 January 2026, within an intraday range of $497.06 to $499.60, on Capital.com’s platform as of 10:05am UTC. Past performance is not a reliable indicator of future results.
The stock is trading in the early stages of the post-Warren Buffett era after Greg Abel formally took over as chief executive, a transition that has attracted close scrutiny from market participants following Buffett’s retirement from the role (Financial Times, 31 December 2025). Recent coverage has also highlighted Berkshire’s completion of a roughly $9.7bn acquisition of Occidental’s chemical unit, OxyChem, on 2 January 2026, adding to its portfolio of industrial and energy-related businesses (ICIS, 2 January 2026). This has occurred against a broader backdrop in which US equities have remained supported, with the S&P 500 recently closing at fresh highs (Reuters, 9 January 2026).
Berkshire Hathaway stock forecast 2026–2030: Third-party price targets
As of 13 January 2026, third-party Berkshire Hathaway stock predictions highlight a wide dispersion between model-driven forecasts and traditional broker targets, reflecting differing views on valuation, capital allocation and the post-Buffett leadership transition.
Investing.com (consensus 12-month target)
Investing.com reports a consensus 12-month BRK stock forecast (class B shares) of around $528.70. This figure is based on a relatively small sample of covering analysts and implies moderate upside relative to late-2025 spot levels. The platform frames this assessment within a broader US equity environment it describes as supportive, with valuation metrics and portfolio composition cited as key inputs to the aggregated target range (Investing.com, 23 December 2025).
Simply Wall St (DCF-based fair value)
Simply Wall St says its discounted cash flow (DCF) model implies Berkshire Hathaway Class B shares are about 36.4% below its estimated fair value, suggesting an intrinsic value materially above the then trading price of around $499. The analysis notes that the gap reflects assumptions about long‑term earnings growth and cash generation amid Berkshire’s diversified portfolio of operating businesses and listed equity holdings (Investing.com, 11 January 2026).
Stock Analysis (single-analyst 12‑month target)
Stock Analysis reports that one covering analyst maintains a 12‑month BRK.B stock forecast of $595, alongside a Strong Buy rating in its classification system. The site notes this view as part of a broader assessment that factors in Berkshire’s recent earnings trajectory, portfolio mix, and relatively low beta versus the wider US equity market (Stock Analysis, 11 January 2026).
Long Forecast (statistical price projection)
Long Forecast’s update projects Berkshire Hathaway’s share price to average about $498 in January 2026, within a monthly range between approximately $454 and $542s, before drifting to an indicated $494 at month end. The service presents these figures as part of a mechanical, long‑horizon statistical forecast path for BRK.B, amid wider assumptions about trend persistence and historical price behaviour (Long Forecast, 11 January 2026).
Predictions and third-party forecasts are inherently uncertain, as they cannot fully account for unexpected market developments. Past performance is not a reliable indicator of future results.
BRK stock price: Technical overview
The BRK stock price is around $497.88 as of 10:05am UTC on 13 January 2026, sitting just below a dense cluster of moving averages. The 20-, 50-, 100- and 200-day simple moving averages are grouped around $500, $500, $497 and $497 respectively. The 14-day RSI stands near the mid-range at 48.59, pointing to neutral momentum, while a weak ADX reading of around 12.30 suggests a lack of a strong directional trend on the daily timeframe.
On the upside, the nearest Classic resistance level is R1 at $515.13, with a sustained daily close above that area potentially bringing the R2 region near $527.60 back into focus. On pullbacks, the Classic Pivot at $502.03 provides initial support, with the 100-day SMA close by at around $496.90 forming an additional technical reference point. A break below this zone could open the way toward S1 near $489.55 (TradingView, 13 January 2026).
This technical analysis is provided for informational purposes only and does not constitute financial advice or a recommendation to buy or sell any instrument.
Berkshire Hathaway share price history (2024–2026)
BRK’s stock price (B shares) has risen steadily over the past two years, moving from approximately $361.22 at the close on 16 January 2024 to $497.88 as of 13 January 2026. Over this period, the stock spent much of 2024 consolidating in the low- to mid-$400 range before advancing toward the $500 area during the first half of 2025. Price action then oscillated around that level into early 2026, reflecting a period of consolidation following the earlier advance.
Past performance is not a reliable indicator of future results. Share prices are indicative and may differ from live market prices.
Berkshire Hathaway (BRK): Capital.com analyst view
Berkshire Hathaway’s Class B share price has been relatively stable over the past year, with the stock oscillating around the $500 level into mid-January 2026 as markets continue to assess a significant leadership transition alongside ongoing deal activity. The completion of the $9.7bn OxyChem acquisition at the start of January 2026 adds another large, cash-generative industrial asset to Berkshire’s portfolio. Some market participants may view this as reinforcing the group’s diversified earnings base, while others may focus on execution considerations and the potential impact on cash balances.
The transition from Warren Buffett to Greg Abel as chief executive at the start of 2026 remains a central narrative. Several commentators have highlighted continuity in Berkshire’s decentralised operating model and long-term orientation, even as markets consider the possibility of differences in capital allocation priorities under new leadership. At the same time, Berkshire’s earnings remain exposed to broader US and global macroeconomic conditions through its insurance, industrial, consumer and equity investment operations. As a result, factors such as interest rates, economic growth and market volatility may support performance in certain environments while acting as headwinds in others.
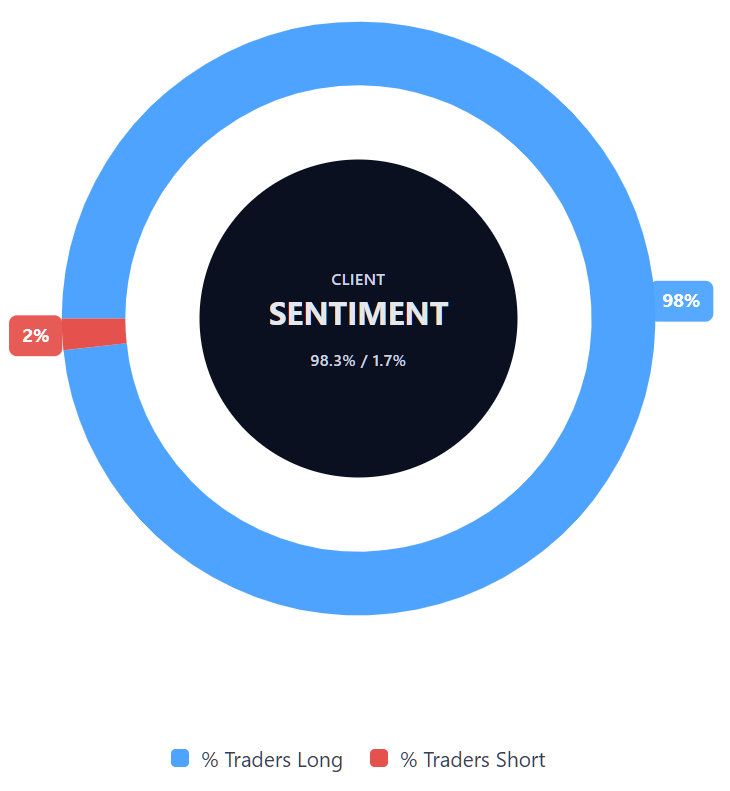
Capital.com’s client sentiment for Berkshire Hathaway CFDs
As of 13 January 2026, Capital.com client positioning in Berkshire Hathaway CFDs currently shows a strong skew toward long positions, with buyers accounting for 98.3% of open client CFD positions compared with 1.8% held by sellers. This places buyers ahead by approximately 96.5 percentage points. This reflects the distribution of open positions on the platform rather than an indication of future price direction, and the snapshot can change over time.
Summary – Berkshire Hathaway stock price
- Berkshire Hathaway (BRK) traded largely within a $480 to $520 range through much of 2025, with the share price hovering close to the $500 level toward year-end.
- Daily closing prices during 2025 indicate relatively low volatility compared with some peers, with pullbacks toward the mid-$470s often followed by moves back into the $490 to $510 range.
- Technical indicators into late 2025 and early 2026 suggest a broadly neutral backdrop, with RSI readings near the mid-range and a weak ADX pointing to the absence of a strong prevailing trend.
Past performance is not a reliable indicator of future results.
FAQ
Who owns the most Berkshire Hathaway stock?
What is the five-year Berkshire Hathaway share price forecast?
There is no single, agreed five-year price forecast for Berkshire Hathaway. Longer-term projections vary widely, depending on assumptions around earnings growth, capital allocation, market conditions and leadership continuity following Warren Buffett’s retirement as chief executive. Some models extend current valuation frameworks forward, while others rely on scenario-based or algorithmic approaches. Such projections are inherently uncertain and are typically used for illustrative purposes rather than as predictions, as they cannot account for unexpected economic or market developments.
Is Berkshire Hathaway a good stock to buy?
Could Berkshire Hathaway stock go up or down?
Should I invest in Berkshire Hathaway stock?
Can I trade Berkshire Hathaway CFDs on Capital.com?
Yes, you can trade Berkshire Hathaway CFDs on Capital.com. Trading share CFDs lets you speculate on price movements without owning the underlying asset and to take long or short positions. However, contracts for difference (CFDs) are traded on margin, and leverage amplifies both profits and losses. You should ensure you understand how CFD trading works, assess your risk tolerance, and recognise that losses can occur quickly.