What is a balance sheet?

Before choosing a stock to invest in, experienced traders often check a company’s financial health. One of the key ways to gain this insight is by reviewing the balance sheet. Often referred to as a ‘snapshot’ of a company’s financial position at a specific point in time, the balance sheet gives an overview of what a company owns, what it owes, and what’s left for its shareholders.
What is a balance sheet?
To define a balance sheet simply: it’s a financial statement that reports a company’s assets, liabilities, and shareholders’ equity at a particular point in time. Its fundamental principle is captured in the accounting equation:
This equation highlights that a company’s assets are financed either through debt (liabilities) or equity (owner contributions and retained earnings).
The balance sheet offers transparency into a company’s financial structure, helping traders understand the fundamentals and make more informed decisions.
Read our guide on the essentials of trading before starting out in the markets.
What are the components of a balance sheet?
To understand the meaning of a balance sheet in business, here are its core components:
Assets: what a company owns
Assets represent everything a company owns that has economic value and can be used to generate future economic benefits. There are two main types:
-
Current assets: expected to be converted to cash or used within one year (or one operating cycle, whichever is longer). Examples include cash, cash equivalents, accounts receivable, inventory and prepaid expenses.
-
Non-current assets: not expected to convert to cash within a year. Examples include property, plant and equipment, long-term investments, and intangible assets like patents or trademarks.
Liabilities: what a company owes
Liabilities are financial obligations or debts owed to external parties, divided into:
-
Current liabilities: due within one year or operating cycle. Examples include accounts payable, short-term loans, accrued expenses and unearned revenue.
-
Long-term liabilities: obligations not due within a year, such as long-term loans, deferred tax liabilities and pension obligations.
Equity: what belongs to the owners
Equity is the residual value of assets after deducting liabilities. It includes share capital (or contributed capital), retained earnings and treasury stock. Equity represents what would be left for shareholders if all debts were paid.
Why is a balance sheet important for traders?
A balance sheet highlights a company’s financial strength and stability, helping you assess how well it can handle economic downturns or capitalise on growth.
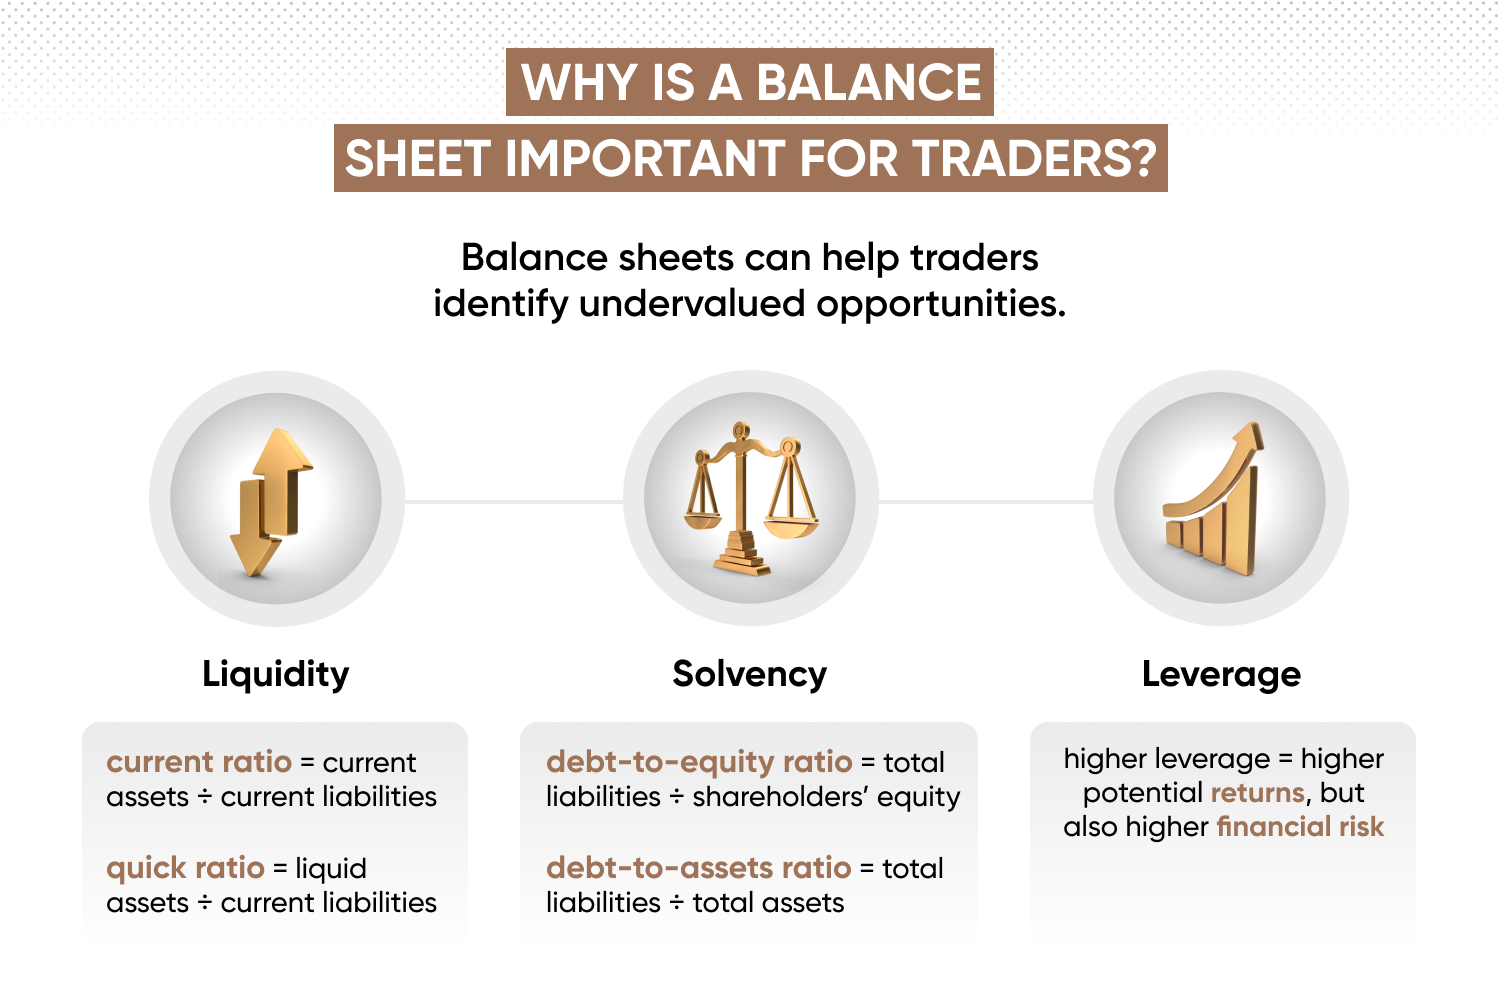
Liquidity
Liquidity is the ability to meet short-term obligations. Traders assess this through the current ratio (current assets ÷ current liabilities) and quick ratio (liquid assets ÷ current liabilities). Strong liquidity suggests low short-term risk.
Solvency
Solvency reflects the company’s ability to meet long-term obligations. Traders use the debt-to-equity ratio (total liabilities ÷ shareholders’ equity) and debt-to-assets ratio (total liabilities ÷ total assets) to assess reliance on debt. A high ratio may signal higher risk.
Leverage
Leverage measures how much debt a company uses to finance assets. While it can enhance returns, it also increases risk. So, trading strategies must consider whether a company’s leverage is sustainable (if cash flows can service debt sustainably).
Applying it in trading decisions
Balance sheets can help traders identify undervalued opportunities. A company with strong assets, low debt and profitability – but a low share price – could present a buying opportunity. Conversely, deteriorating balance sheets (eg, rising debt, falling cash or shrinking equity) may be red flags that prompt traders to consider shorting the stock via CFD trading.
Practise going long and short on your favourite stocks, risk-free. Open a demo account on Capital.com.
How to read a balance sheet
While the layout might vary slightly, most balance sheets follow a standard structure. Here’s how to read a balance sheet:
- 1. Understand the accounting equation: assets must equal the sum of liabilities and equity.
- 2. Start with assets:review total assets. A strong balance of current assets indicates liquidity; robust non-current assets suggest long-term strength.
- 3. Move to liabilities: compare current and long-term obligations. High long-term debt may be fine if earnings and cash flow can cover it.
- 4. Analyse equity: indicates how much of the business is financed by owners or reinvested profits. Growing retained earnings is a good sign.
- 5. Use key ratiosReturn on assets (ROA): net income / total assets
Return on equity (ROE): net income / shareholders’ equity - 6. Identify trends: compare balance sheets over time. Are assets growing? Is debt manageable? Are earnings retained?
- 7. Look for red flags: rapidly increasing debt, declining cash, swelling receivables or inventories, and negative equity can signal problems.
Practical tips for analysing a balance sheet
What a balance sheet offers goes beyond the numbers.
Industry-specific focus
Different industries emphasise different metrics. A manufacturing firm may show large PP&E, while software firms may have higher intangibles. In retail, inventory turnover matters; in construction, long-term contracts are key. Always compare balance sheets to industry peers for context.
Also remember: the balance sheet is just one part of the story. Combine it with income and cash flow statements for a full financial picture. Consider other qualitative factors like leadership, competition, regulation and macro trends.
Ready to put your knowledge into practice? Create an account with us, and refer to our market guides for insights on trading different asset classes.
FAQs
What is a balance sheet in simple words?
A balance sheet is a financial report that lists a company's assets, liabilities and equity at a specific point in time. Think of it as a financial snapshot.
What does a balance sheet show?
A balance sheet shows a company’s financial position, providing insights into its liquidity, solvency and overall financial structure.
How do traders use balance sheets?
Traders use balance sheets to assess a company’s financial health, identify potential risks and opportunities.
What is the difference between a balance sheet and an income statement?
The key difference is their time horizon. A balance sheet is a snapshot of a company's financial position at a single point in time, while an income statement summarises a company's revenues, expenses, and profits over a period of time (eg, a quarter or a year).