SMCI stock forecast: Third-party price targets
Super Micro Computer (SMCI) last traded at $45.46, moving within an intraday range of $44.66–$46.86 on Thursday, 26 September 2025.
The stock was up 0.26% from the previous close, holding around the mid-point of its daily range. Client sentiment on Capital.com shows 94.76% of positions are long.
Recent performance aligns with broader artificial intelligence (AI) infrastructure growth, with global AI data centre hardware spending projected to reach $495.1bn in 2025. Super Micro’s positioning reflects continued demand for AI-optimised servers. On 22 September, the company unveiled new systems at its Madrid INNOVATE event, featuring Nvidia’s HGX B300 and GB300 NVL72 rack-scale solutions. Industry forecasts suggest AI infrastructure spending could expand by more than 30% annually, driving demand for specialised computing solutions in hyperscale deployments amid intensified global competition for technological edge (Financial Content, 25 September 2025).
SMCI stock forecast: Analyst price target view
Goldman Sachs (equity research)
Goldman Sachs maintains a $27 price target as of 6 August 2025 with a Sell rating, citing competitive pressures from Dell Technologies and HP Enterprise, alongside margin compression in the server industry. The firm highlights Super Micro’s multi-year low non-GAAP gross margin of 9.6%, combined with record operating expenses and intensifying market share losses to larger rivals (AInvest, 6 August 2025).
Bernstein (initiation coverage)
Bernstein initiated coverage with a Market Perform rating and a mean price target of $46.87, positioning the stock as fairly valued amid AI infrastructure demand. The firm underlined Super Micro’s presence in GPU-optimised servers while noting that governance review processes are already reflected in current share price levels (Nasdaq, 16 September 2025).
Citi (neutral stance)
Citi raised its price target to $52 from $37 as of 11 July 2025 while keeping a Neutral rating. The bank observed stronger AI server demand as supply constraints for Blackwell GPUs eased. It projects Q4 fiscal 2025 revenue of $6.07bn and anticipates Q1 fiscal 2026 revenue of $7.02bn, with earnings per share at $0.65 (Yahoo Finance, 4 August 2025).
JP Morgan (sector coverage)
JP Morgan reduced its price target to $45 from $46 while maintaining a Neutral rating. The bank noted capital constraints and customer specification changes that hindered fiscal Q4 execution. It forecasts fiscal 2026 revenue of $33bn, down from previous $36bn estimates, with updated earnings projections reflecting execution challenges (AInvest, 9 August 2025).
Needham (buy recommendation)
Needham increased its price target to $60 from $39 as of 6 August 2025 while maintaining a Buy rating, applying a multiple of 16x to fiscal 2027 non-GAAP earnings per share estimates of $3.70. The firm expects near-term margin pressure from larger deals and tariff costs but sees improvement as the company scales its Data Center Building Block Solutions and pursues new growth markets (Investing.com, 6 August 2025).
Predictions and third-party forecasts are often inaccurate, as they cannot account for unforeseen market developments. Past performance is not a reliable indicator of future results.
Super Micro Computer stock price: Technical overview
Super Micro Computer (SMCI) is trading at $45.46, with momentum indicators giving mixed signals as it remains above a key moving average cluster. The 20-, 50-, 100- and 200-day SMAs are at approximately $44, $47, $45 and $41, with shorter-term averages providing nearby support, while the 50-day SMA at $47.39 acts as immediate resistance. The RSI (14) is 55.06, in neutral territory, suggesting neither overbought nor oversold conditions. The ADX (14) at 21.33 indicates modest trend strength.
The first level to monitor on the upside is the $53.52 pivot zone (R1). A sustained daily close above this level would bring the $65.51 area back into focus and could open the way towards higher resistance. The MACD is showing a buy signal at 0.25, supporting near-term momentum while price holds above the moving average cluster.
On the downside, initial support lies at the $47.42 classic pivot, followed by the 20-day SMA near $43.83. A move below the 200-day SMA around $40.90 could increase the risk of a decline towards $35.43 support, signalling a more significant technical breakdown (TradingView, 26 September 2025).
This technical analysis is for informational purposes only and does not constitute financial advice or a recommendation to buy or sell any instrument.
Capital.com’s client sentiment for SMCI CFDs
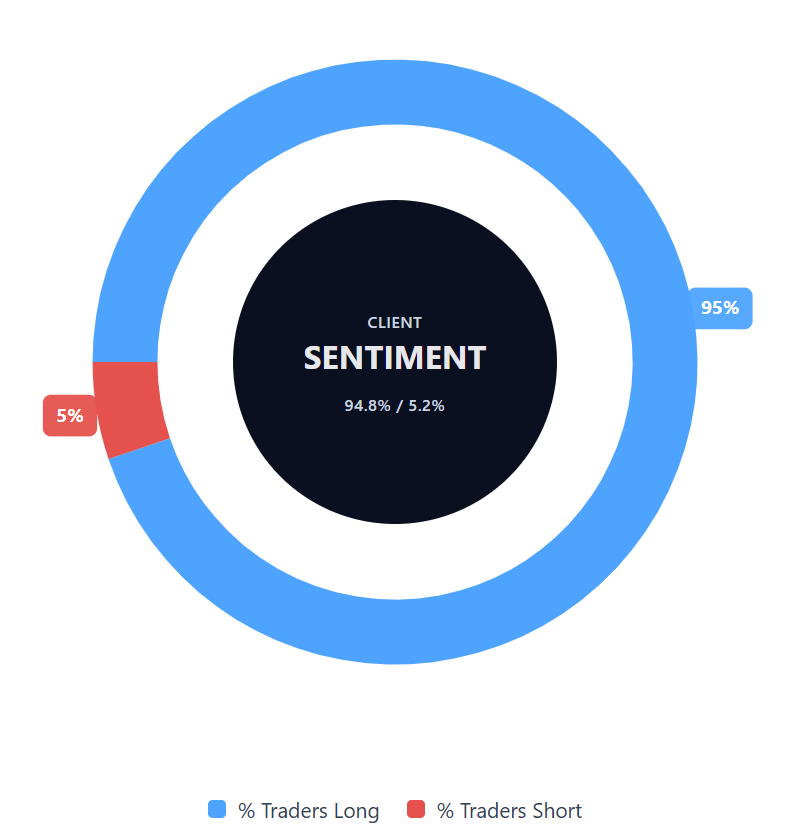
Capital.com client positioning in SMCI CFDs shows 94.8% of traders are long, compared with 5.2% short – a difference of around 90 percentage points (26 September 2025). This represents a heavily skewed bias towards long positions among retail clients on the platform. Figures reflect current open positions on Capital.com and are subject to change.
FAQ
What is the 5-year forecast for SMCI stock?
Analyst targets for SMCI vary. Recent third-party estimates range from Goldman Sachs’ $27 Sell rating to Needham’s $60 Buy rating, with consensus near $45–$48. Forecasts beyond the short term are uncertain, as they cannot account for unforeseen market developments.
Is SMCI a good stock to buy?
Capital.com does not provide investment advice. Third-party analysts note both rising demand for AI infrastructure and challenges in execution within the server industry. Whether a stock is suitable depends on individual objectives and risk tolerance.
Could SMCI stock go up or down?
SMCI’s price can rise or fall depending on market conditions, company performance and broader technology sector trends. Technical indicators currently show mixed signals, with support and resistance levels shaping short-term price action.
Should I invest in SMCI stock?
Capital.com does not make investment recommendations. Trading SMCI CFDs involves risk, and past performance is not a reliable guide to future results. Traders should evaluate their own financial situation and risk management approach. Contracts for difference (CFDs) are traded on margin. Leverage higher than 1:1 amplifies both potential gains and potential losses.