Commodities Latest: Oil up, Natural Gas down, Gold and Silver heat up
Commodities have started the week with strong moves, but the direction differs based on each fundamental drivers.
Commodities have traded with mixed momentum recently, reflecting a market that is balancing geopolitical risks, shifting macro expectations and uneven demand signals.
Oil attempts to recover as geopolitics offer a boost
Oil prices are getting a boost on Monday after having been largely range-bound in the past few days, with both WTI and Brent supported on dips but struggling to sustain upside. Ongoing geopolitical tensions, including developments around Venezuelan exports and broader Middle East risks, have added a modest risk premium, while OPEC+ supply discipline continues to underpin the market. Because the market was leaning heavily bearish, supply risks are back in focus, and technical short covering is amplifying the move on the upside.
However, concerns about global demand and slower growth momentum have capped rallies, leaving crude prices oscillating within ranges with a bearish bias. The key test for bullish momentum will be re-entering the $58.50 - $60 range, and whether a break above then can be sustained. OPEC+ has expressed it is comfortable with crude trading in the low $60, high $50s, so there likely won’t be any move to stabilise prices in this current environment.
US Crude (WTI) daily chart
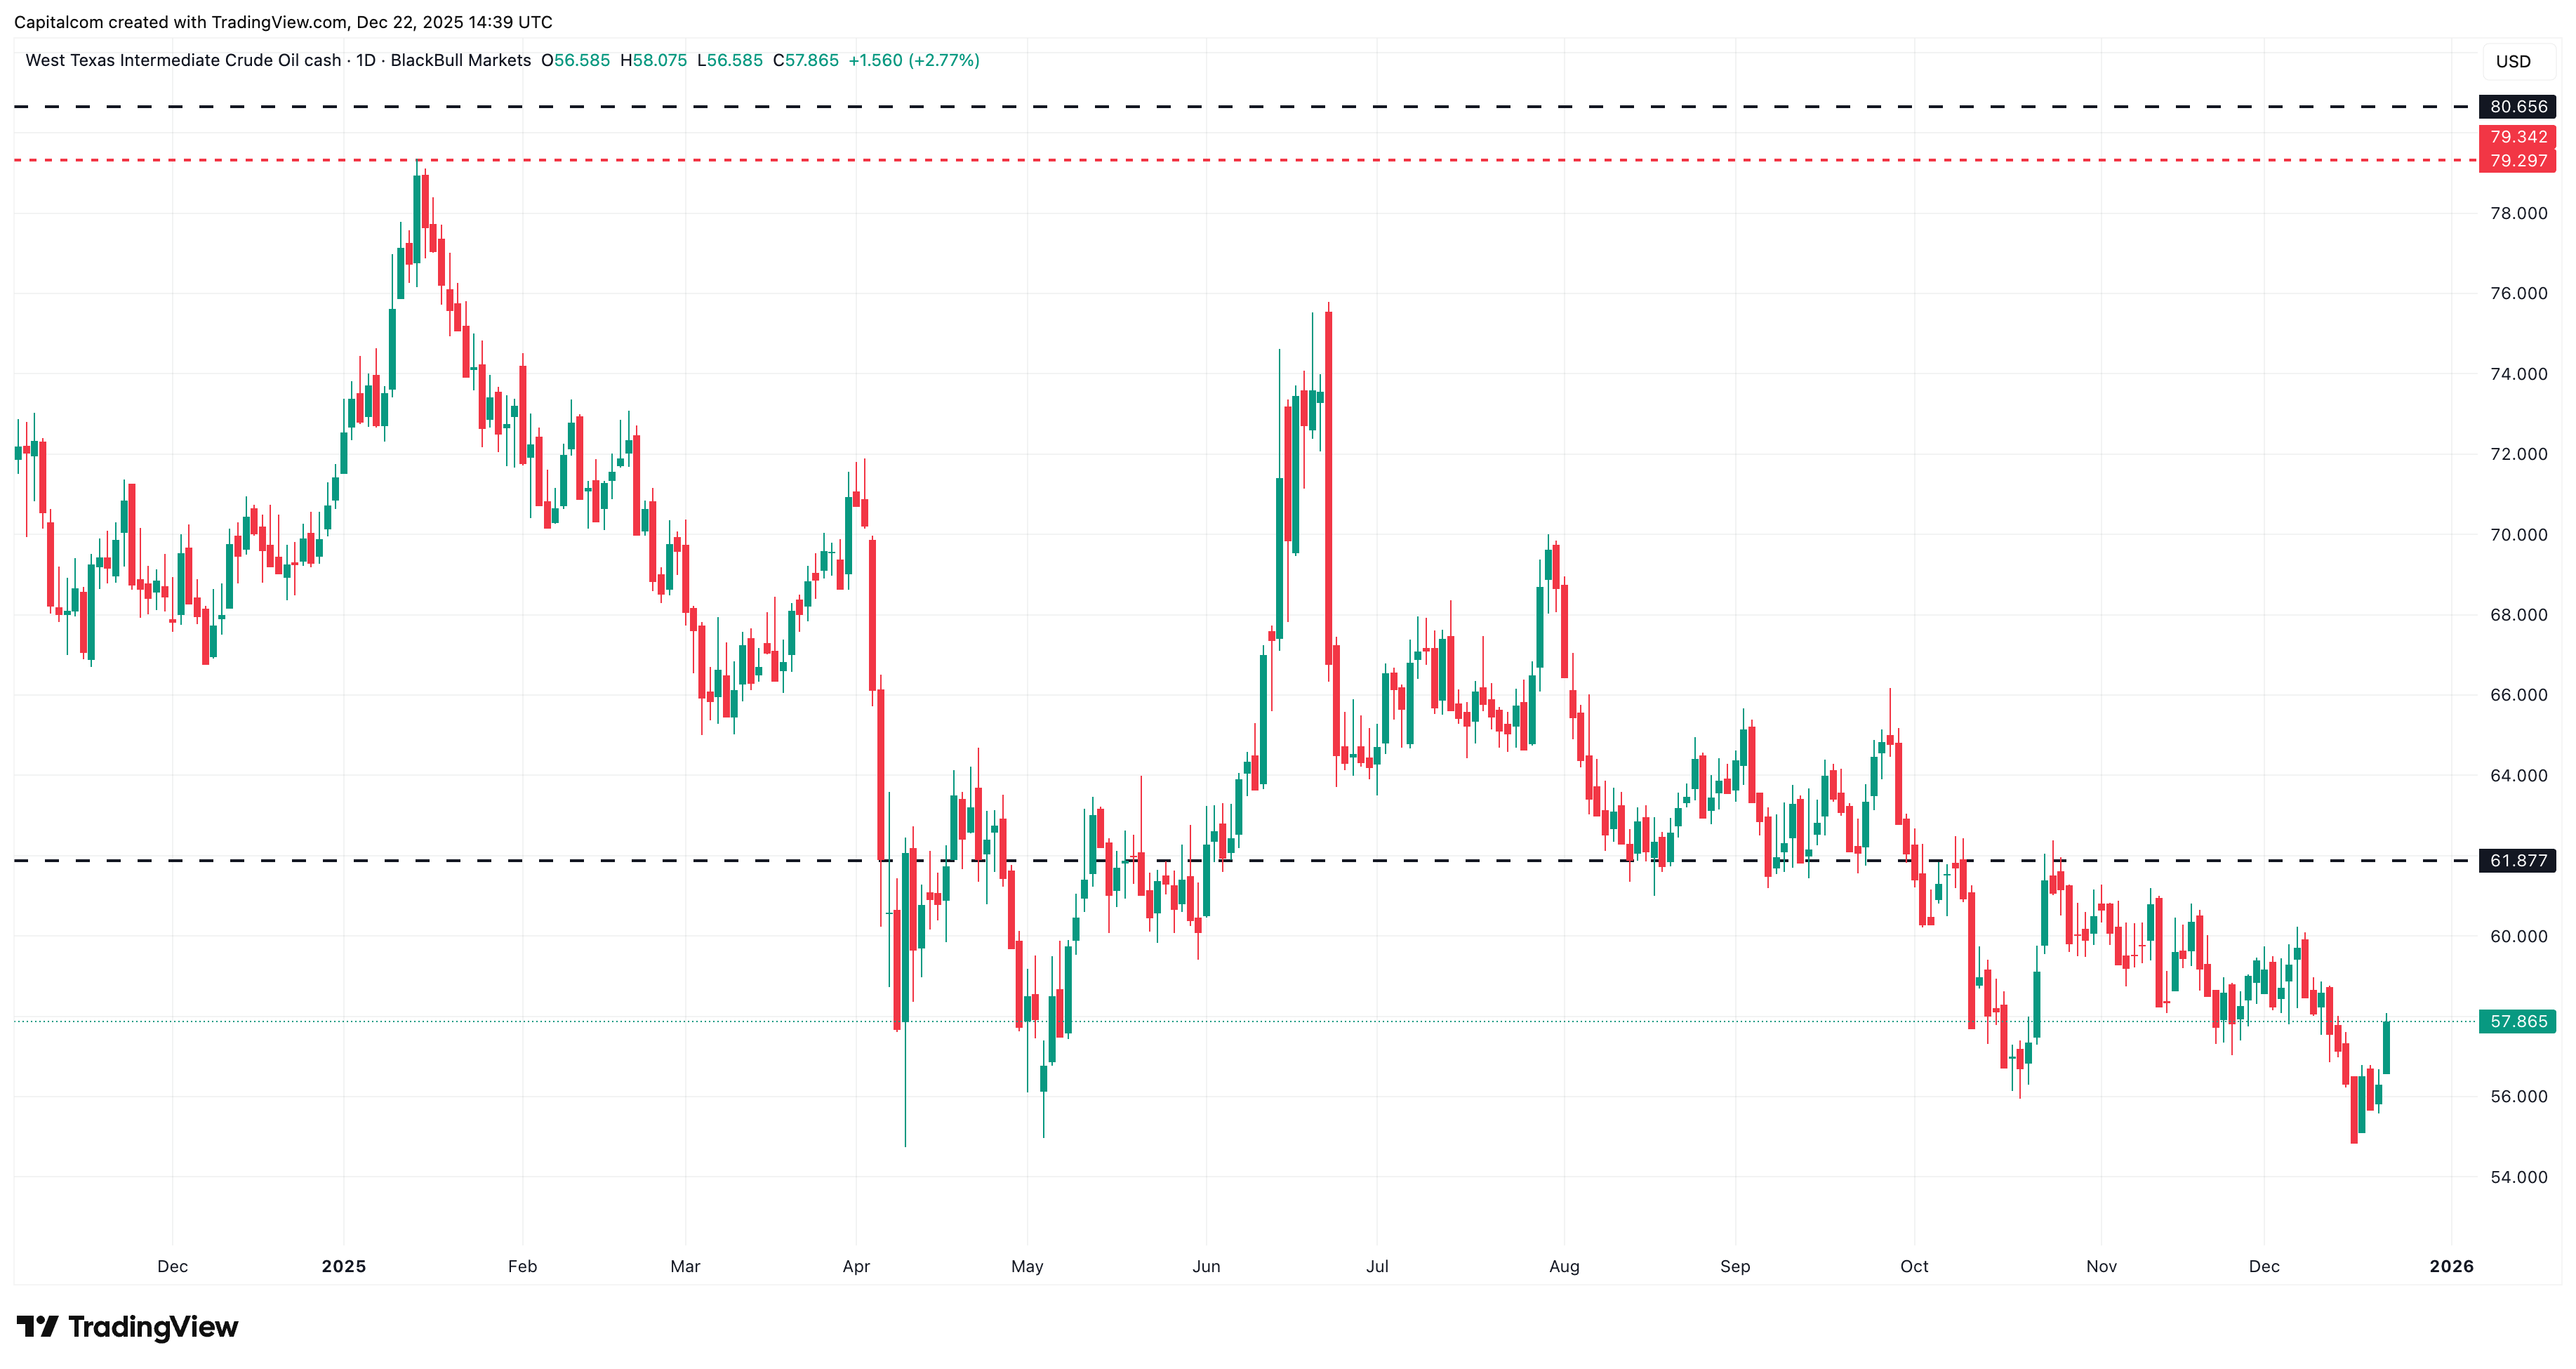
Past performance is not a reliable indicator of future results.
Natural Gas faces increased downside pressure
Natural gas has seen a sharp decline since the December 5th highs, having dropped over 30% since then. The commodity is down another 5% on Monday, breaching the $3.60 level for the first time since October. The moves have been driven primarily by seasonal factors and geopolitical uncertainty. Weather forecasts remain a key swing factor, with colder conditions lifting demand expectations and milder outlooks quickly limiting upside. The early-December spike was driven by forecasts for sustained cold across key US demand regions, which prompted aggressive speculative buying. Since then, models have consistently shifted toward milder-than-normal temperatures, sharply reducing heating demand expectations at a time when the market was positioned for scarcity
European energy security concerns linked to Russia–Ukraine tensions continue to influence pricing indirectly through LNG flows, while storage levels have also played an important role in shaping short-term moves, with inventories still well above critical stress levels, and US production remaining historically high.
The daily chart is showing the RSI nearing oversold levels, near where buying momentum usually arises. There may still be further room to drop but XNG/USD is close to entering a key sideways range, where support is often found between $3.58 and $3.38, but upside can also be limited below $3.65.
Natural Gas (XNG/USD) daily chart
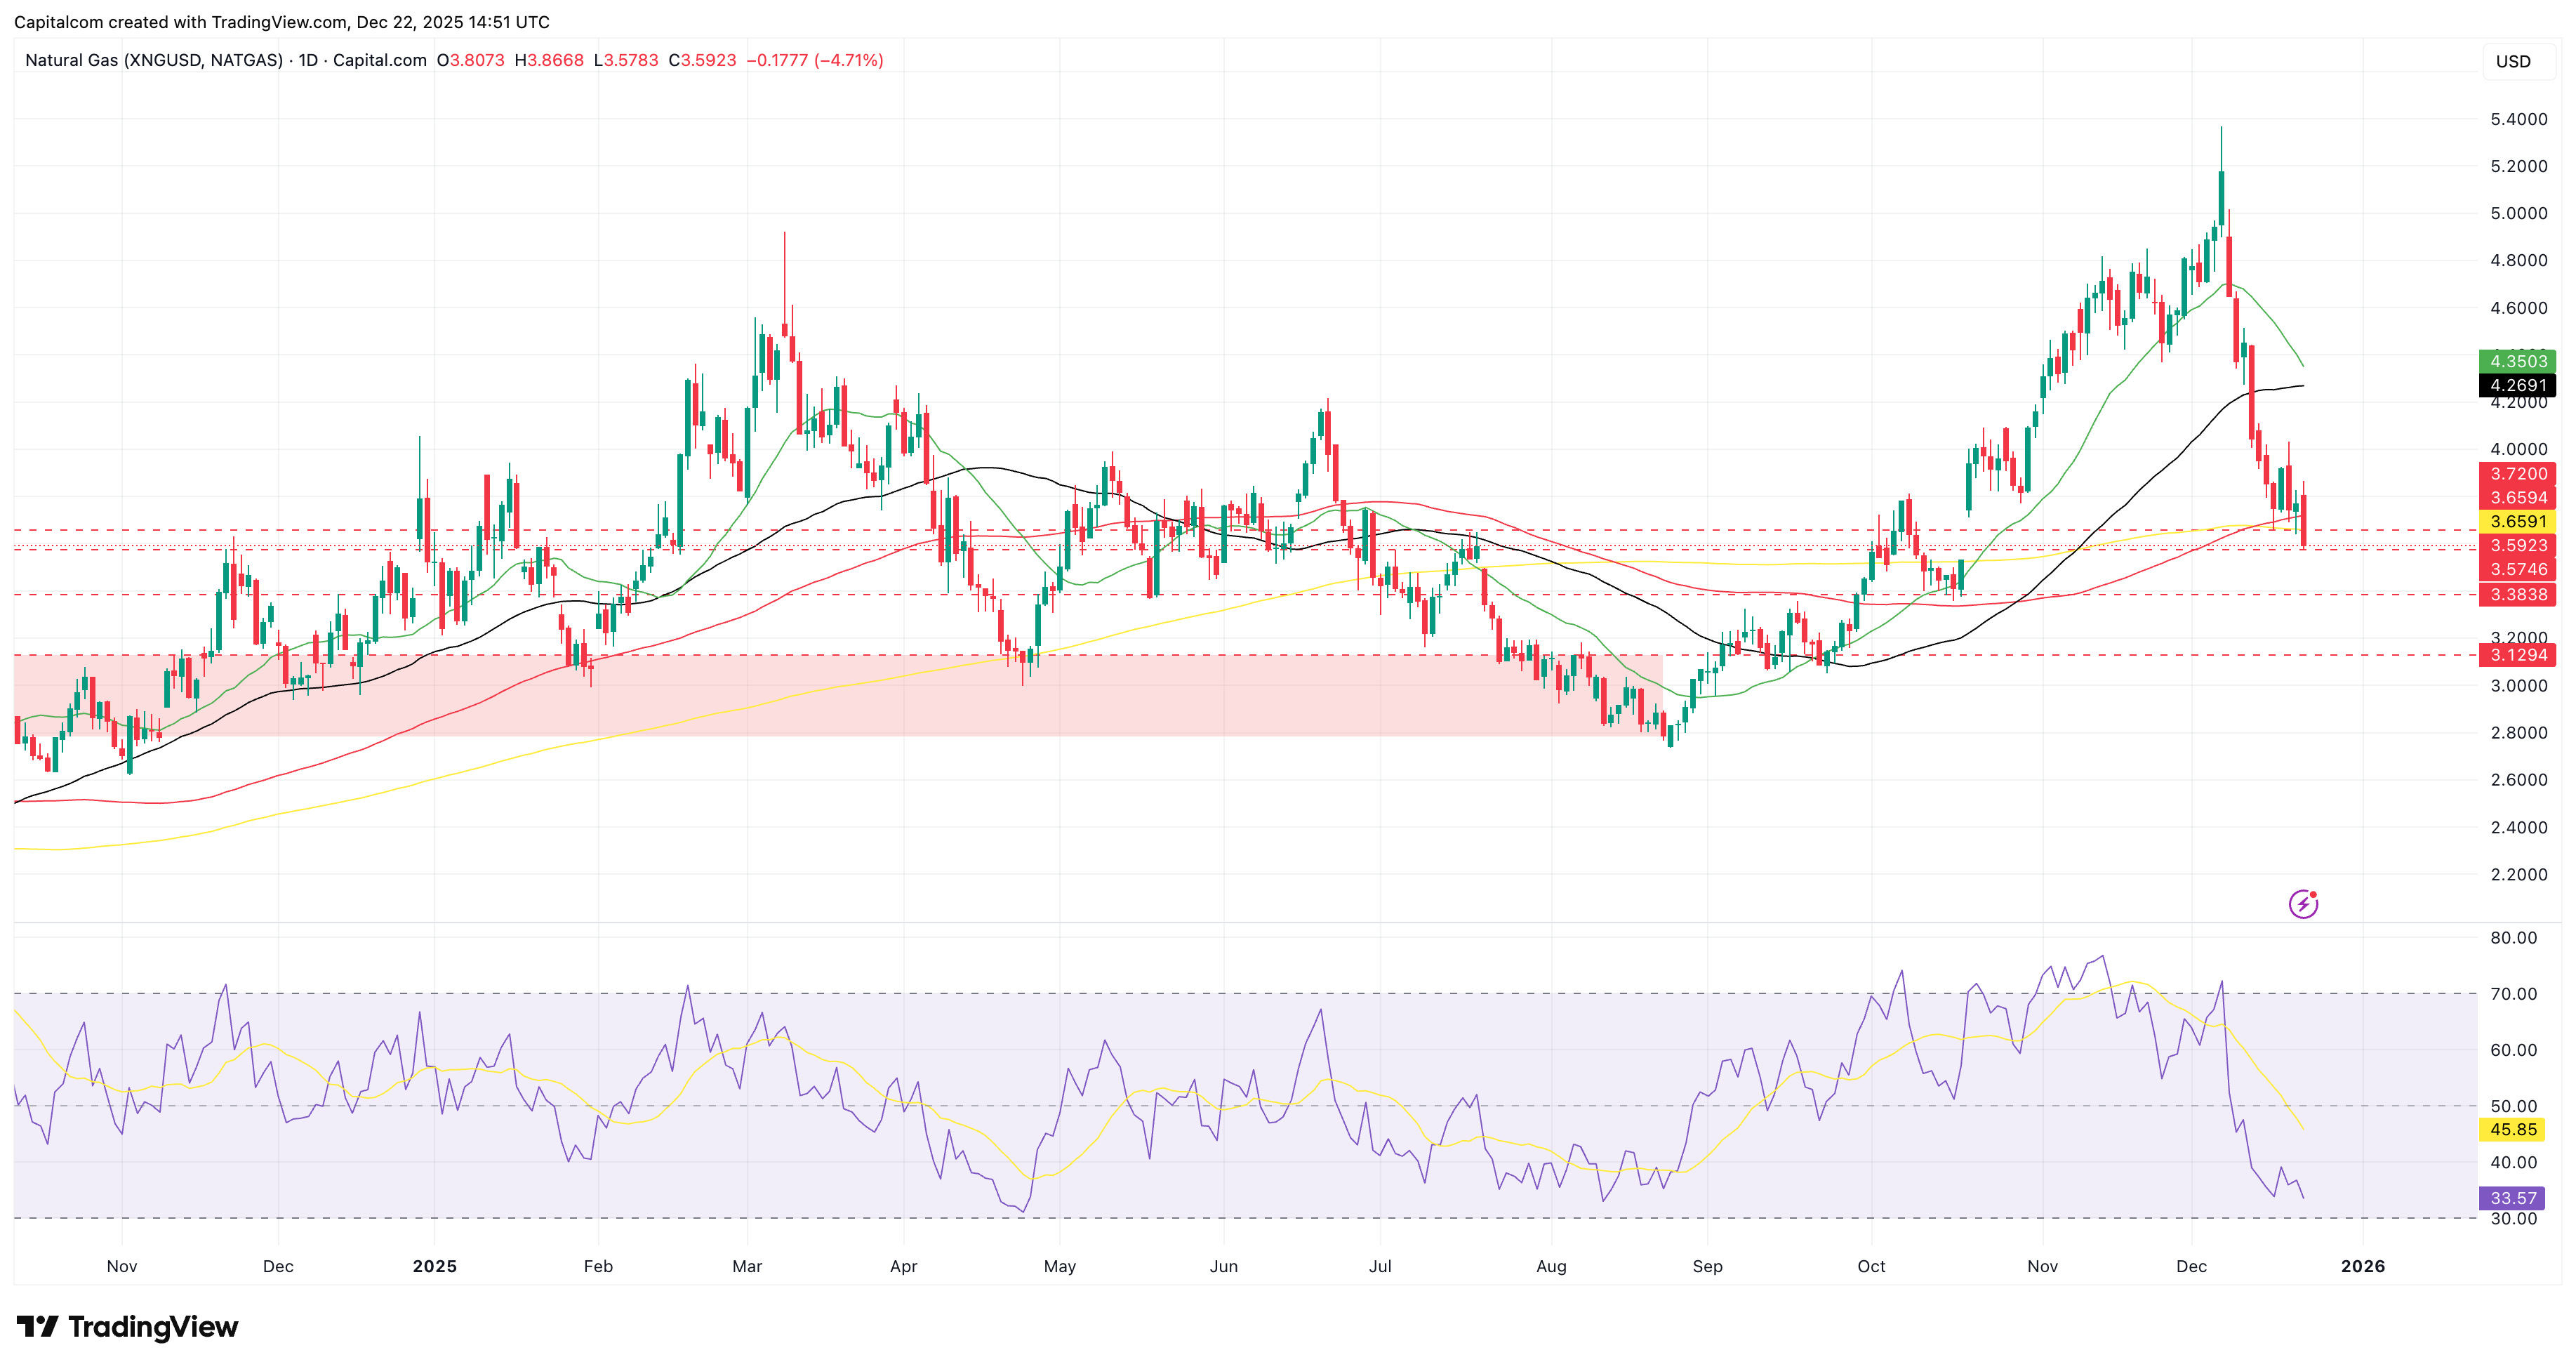
Past performance is not a reliable indicator of future results.
Gold and Silver continue to shine
Among precious metals, gold has been one of the stronger performers, supported by falling real yields, expectations of further central bank easing and lingering macro uncertainty. Demand for gold as a hedge has remained steady, reinforced by ongoing central-bank purchases and cautious sentiment in equity markets. While the metal has seen periods of consolidation, the broader technical structure remains constructive, with gold continuing to trade near recent highs as long as yields stay contained.
Silver, by contrast, has rallied much more aggressively than gold, pushing the gold-silver ratio sharply lower and signalling significant outperformance. While part of the move is underpinned by silver’s industrial demand story, particularly in technology, solar and electrification, the speed and steepness of the rally point to increasingly speculative positioning. Price action has become more exponential, with limited consolidation and elevated volatility, suggesting that silver is more vulnerable to sharp pullbacks if sentiment shifts. Overall, the commodity complex reflects cautious optimism, with gold offering defensive stability, oil and gas trading tactically on supply and demand risks, and silver standing out as the most stretched and speculative of the group.
Gold (XAU/USD) daily chart
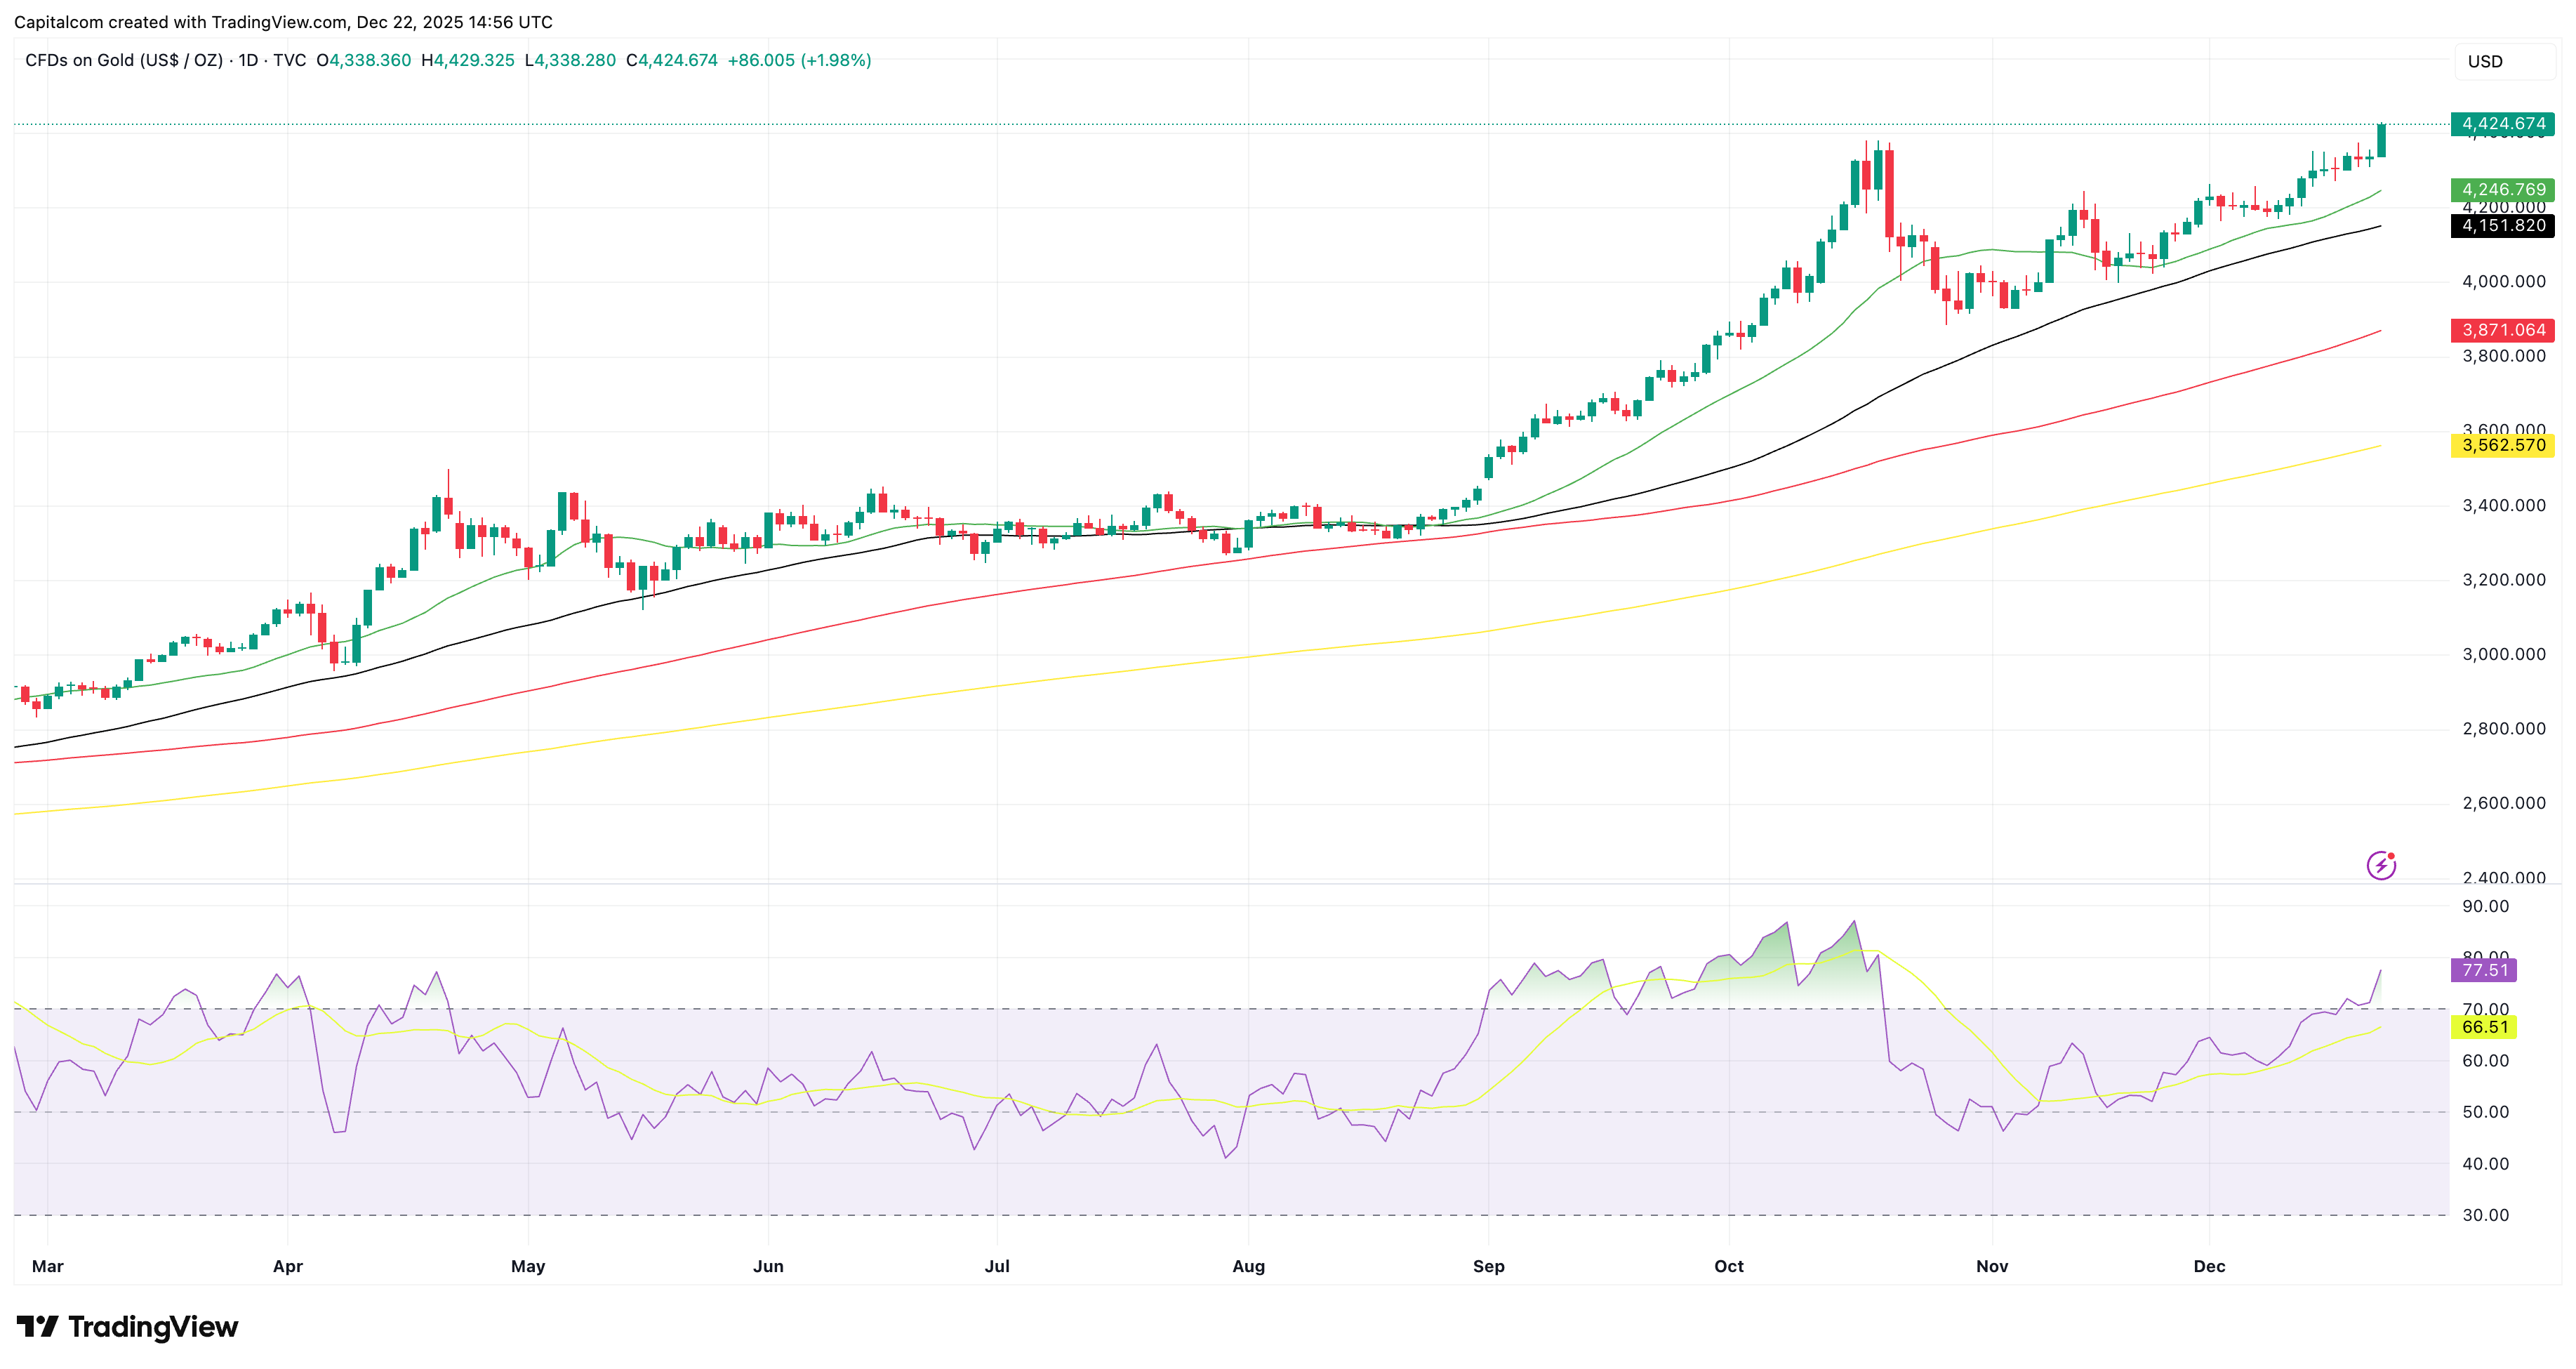
Past performance is not a reliable indicator of future results.