Charles Schwab stock forecast: Third-party price targets
Charles Schwab (SCHW) is trading at $93.40 as of 9:42am UTC on 14 October 2025, within an intraday range of $91.93–$94.56.
Pressure stems from subdued sentiment across the financial sector (Reuters, 14 October 2025) , after renewed U.S.–China trade tensions weighed on European banking stocks (Reuters, 14 October 2025). Meanwhile, the U.S. 10-year Treasury yield eased to around 4.02% as markets priced in expectations of a potential Federal Reserve rate cut later this month (Trading Economics, 13 October 2025).
Charles Schwab stock forecast: Analyst price target view
BMO Capital (coverage initiation)
BMO Capital initiated coverage with an Outperform rating and a $110 price target. The firm expects a ‘bank-lite’ strategy to enhance capital efficiency, while balance sheet recovery may support valuation improvements as the company considers using third-party banks for excess funding beyond its lending requirements (TipRanks, 2 October 2025).
Barclays (quarterly update)
Barclays raised its price target to $114 from $113, maintaining an Overweight rating as trading activity remained robust through Q3. The firm noted that interest-earning assets expanded across brokers, though Federal funds rate cuts could present larger headwinds than previously estimated (MarketScreener, 8 October 2025).
Morgan Stanley (sector update)
Morgan Stanley reduced its target to $130 from $131, while maintaining an Overweight rating amid sector-wide adjustments. The firm indicated that brokers may benefit from improved visibility on rate trajectories and sustained retail participation, despite short-term market challenges (TipRanks, 1 October 2025).
Forecasts and price targets are inherently uncertain, as they cannot anticipate unexpected market events. Past performance is not a reliable indicator of future results.
SCHW stock price: Technical overview
Charles Schwab (SCHW) is trading at $93.40 as of 9:42am UTC on 14 October 2025, positioned below its main moving-average cluster, with the 20-, 50-, 100- and 200-day simple moving averages (SMAs) at $94, $95, $93 and $86, respectively. This indicates mixed signals across timeframes, as the stock remains below its shorter-term averages but above the longer-term 200-day level. Momentum is muted, with the 14-day relative strength index (RSI) at 48, within neutral territory.
The first resistance area to monitor is the $98.64 pivot zone; a sustained daily close above this level could bring the $101.81 region back into focus and reopen the path towards recent range highs. On the downside, initial support sits near the $94.57 pivot, followed by the $93.05 100-day moving average. A break below that area could expose a deeper move towards the $85.94 200-day moving average, which has previously acted as longer-term support (TradingView, 14 October 2025).
This technical overview is provided for informational purposes only and does not constitute financial advice or a recommendation to buy or sell any instrument.
Charles Schwab share price history
Charles Schwab was founded as a discount brokerage in 1975 and has been publicly traded since 1987, becoming one of the largest investment services firms in the United States.
SCHW reached a high of $99.33 on 13 August 2025 before easing back. Throughout 2024, the stock faced pressure from sector-wide banking concerns and uncertainty around interest rates, opening the year near $69 and experiencing periods of heightened volatility. The shares fell to a low of around $49 in October 2023 amid regional banking stress, before recovering steadily through early 2024.
The stock continued to gain momentum through 2024 and into 2025, rising from the low $70s to the mid-$90s as investor confidence improved. Despite fluctuations in recent months, SCHW has remained relatively stable, supported by firmer sentiment across financial services and steady trading activity.
Charles Schwab last closed at $93.40 on 7 October 2025, up approximately 26.3% year to date and 31.9% year on year.
Past performance is not a reliable indicator of future results
Capital.com’s client sentiment for Charles Schwab CFDs
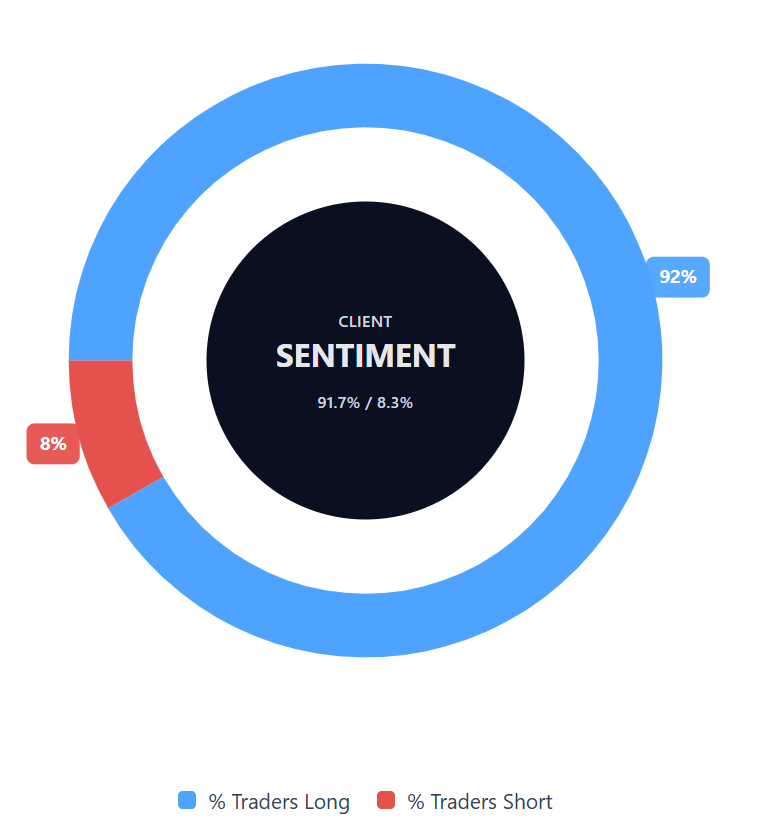
As of 14 October 2025, Client positioning on Capital.com for Charles Schwab CFDs currently indicates strong buying interest, with 91.7% of positions long and 8.3% short. This shows buyers ahead by 83 percentage points, suggesting a prevailing bias towards long positions.
This data represents open positions on Capital.com and is subject to change.
FAQ
Is Charles Schwab a good stock to buy?
Whether Charles Schwab stock is considered a good investment depends on individual analysis and risk tolerance. The company remains among the largest financial services providers in the United States, with its share price influenced by interest rate movements, client asset flows, and overall sector sentiment. It’s important to remember that past performance is not a reliable indicator of future results.
Could Charles Schwab stock go up or down?
Charles Schwab’s share price may rise or fall depending on market conditions, interest rate expectations, and broader financial sector trends. Recent analyst forecasts have ranged, reflecting varying assumptions about asset growth, margins, and earnings prospects. However, forecasts and predictions are often inaccurate, and past performance is not a reliable indicator of future results.
Should I invest in Charles Schwab stock?
Any decision to invest in Charles Schwab should consider personal financial circumstances, investment objectives, and risk appetite. This content does not constitute investment advice. Those looking for exposure to Charles Schwab may use instruments such as contracts for difference (CFDs) to speculate on both upward and downward movements. Bear in mind that CFDs are traded on margin, and leverage amplifies both profits and losses.
What affects the Charles Schwab share price?
The share price is influenced by multiple factors, including changes in US interest rates, client cash levels, trading volumes, and the broader performance of the banking and brokerage sectors. Macroeconomic data and Federal Reserve policy decisions can also shape investor sentiment towards the company.