Applied Digital stock forecast: Third-party price targets
Applied Digital is a US-listed company that designs and operates data centres for high-performance computing workloads. Explore APLD’s recent price action, third-party price targets and technical analysis.
Applied Digital Corporation (APLD) is trading around $35.41 in intraday action as of 3:33pm (UTC) on 15 January 2026, within a session range of $34.90–$36.87. Past performance is not a reliable indicator of future results.
The move comes amid the release of Applied Digital’s fiscal second-quarter 2026 results, in which the company reported revenue of about $126.6 million, up roughly 250% year on year, driven largely by high-performance computing hosting and tenant fit-out revenue at its Polaris Forge facilities (MarketBeat, 8 January 2026).
Applied Digital stock forecast 2026–2030: Third-party price targets
As of 15 January 2026, third-party Applied Digital stock predictions reflect differing assessments of the company’s recent revenue growth and data-centre expansion plans. The following summaries refer to individual brokers’ stated price objectives and are provided for information only, not as recommendations or guarantees of future performance.
Freedom Capital Markets (broker initiation)
Freedom Capital Markets initiated coverage of Applied Digital with a 12-month price target of $36, alongside a positive rating on the shares. The broker cites Applied Digital’s role in high-performance computing infrastructure and recent top-line growth as key supports, while also highlighting execution and market-volatility risks amid rapid sector expansion (Investing.com, 7 January 2026).
Needham & Company (broker rating)
Needham & Company reissued its Buy rating on Applied Digital with a $41 price target, suggesting potential upside relative to the prevailing market price at that time. Needham highlights strong year-on-year revenue growth and momentum in the company’s high-performance computing hosting operations as it scales capacity, while noting ongoing losses and high operating leverage (MarketBeat, 8 January 2026).
Lake Street (broker update)
Lake Street reiterated its Buy stance on Applied Digital with a maintained price target of $45, according to a broker recap that also references other analysts’ views. The commentary attributes this stance to the company’s hyperscale data-centre build capabilities and contracted revenue pipeline following recent quarterly results, set against ongoing sector competition and sensitivity to customer spending plans (MarketBeat, 30 December 2025).
B. Riley Securities (broker revision)
B. Riley Securities lifted its APLD stock forecast to $53 from $47, while maintaining a Buy rating. The broker points to potential incremental hyperscaler agreements and progress on energising key facilities such as PF1 and PF2 as factors behind the revision, while acknowledging execution and project-timing uncertainties inherent in large-scale infrastructure builds (MarketScreener, 9 January 2026).
Predictions and third-party forecasts are inherently uncertain, as they cannot fully account for unexpected market developments. Past performance is not a reliable indicator of future results.
APLD stock price: Technical overview
The APLD stock price is trading around $35.41 as of 3:33pm (UTC) on 15 January 2026, remaining above a rising cluster of simple moving averages, with the 20-, 50-, 100- and 200-day DMAs near approximately 29, 28, 27 and 18 respectively. The 20-over-50 alignment remains in place, and the 14-day RSI around 62.25 sits in the upper-neutral band, while an ADX near 23.97 suggests a developing, though not yet firmly established, trend phase. Price also holds above the Ichimoku base line around 30.72 and the 20-day VWMA near 30.69, even as the short-term Hull MA at 38.03 tilts lower and some secondary oscillators, such as the CCI at about 104 and 10-day momentum at 10.76, point to potentially overextended conditions.
On the topside, the nearest classic pivot resistance sits around R1 at 32.28, with R2 near 40.03 coming back into view only if price sustains a daily close above that first barrier. On pullbacks, the classic pivot at 27.10 marks initial support, backed by the 100-day SMA around 26.60 as an important moving-average shelf. A break below that zone could shift focus towards S1 near 19.35 as the next notable downside reference (TradingView, 15 January 2026).
This technical analysis is for informational purposes only and does not constitute financial advice or a recommendation to buy or sell any instrument.
Applied Digital share price history (2024–2026)
Applied Digital’s share price has seen a substantial shift over the past two years, moving from single-digit levels in early 2024 to trading in the mid-$30s by mid-January 2026. The stock closed at $5.18 on 17 January 2024, dipped as low as $2.44 on 18 April 2024, then began to trend gradually higher through mid-2024, generally holding between about $3.00 and $7.00 into late August.
Momentum picked up sharply in 2025. APLD finished May 2025 at $6.82, then moved into double digits from June, closing at $12.52 on 12 June and continuing higher through the summer before accelerating again in the autumn. Over that period, the stock rose from $19.36 on 15 September to $34.68 on 31 October. After renewed volatility into year-end, including a pullback to $24.19 on 26 December 2025, the stock rallied again at the start of 2026, climbing from $28.22 on 2 January to $38.08 on 12 January, before easing back to $35.49 on 15 January 2026.
Past performance is not a reliable indicator of future results. Share prices are indicative and may differ from live market prices.
Applied Digital (APLD): Capital.com analyst view
The APLD stock price has been highly active into mid-January 2026, with the stock moving from around $6–$7 in mid-2024 to the mid-$30s by early 2026 as the business has scaled its high-performance computing and AI-focused data-centre footprint. Recent quarterly results have underlined that expansion, with fiscal second-quarter 2026 revenue reported at $126.6 million, up 250% year on year, alongside a reduced but still material net loss attributable to common shareholders of $31.2 million. For CFD traders, this combination of rapid top-line growth and ongoing losses means price may react sharply both to positive headlines and to disappointment around utilisation, new contracts or funding.
From a drivers perspective, Applied Digital sits at the intersection of several themes, including demand for AI and high-performance computing capacity, evolving partnerships with hyperscale and infrastructure investors, and broader sentiment towards data-centre and crypto-adjacent names. Sustained investment in AI infrastructure and additional customer agreements may support positive sentiment, while a weaker macro backdrop, higher interest rates or a slowdown in AI spending could weigh on valuations, particularly given the company’s capital-intensive build-out and leverage.
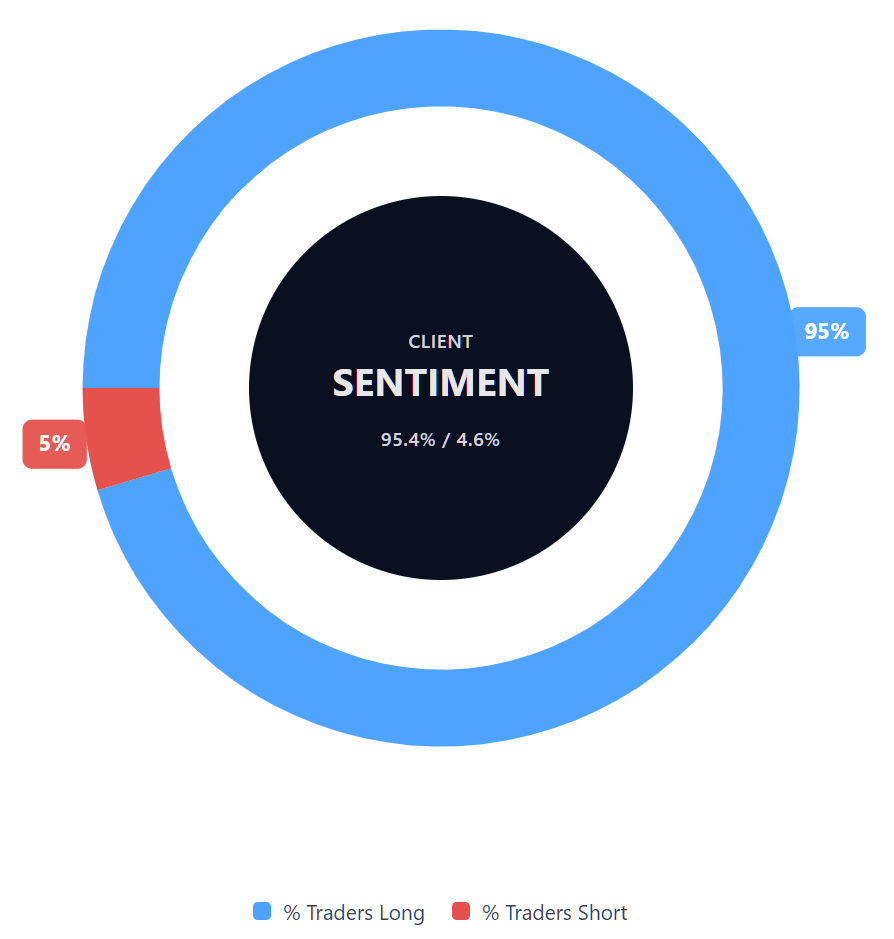
Capital.com’s client sentiment for Applied Digital CFDs
As of 15 January 2026, Capital.com client positioning in Applied Digital CFDs is heavily skewed towards the long side, with buyers at 95.4% versus sellers at 4.7%, representing a one-sided tilt towards longs and placing buyers ahead by around 90.7 percentage points. This snapshot reflects open positions on Capital.com and can change as trades are opened, adjusted or closed.
Summary – Applied Digital stock price
- Applied Digital’s share price climbed sharply through 2025, moving from single-digit levels mid-year to close December at $24.74 on 31 December 2025.
- The stock accelerated particularly in the second half of the year, rising from around $4–$7 in early 2025 to trade above $30 by October before ending the year lower but still well above prior levels.
- Intraday ranges were wide at times, with several sessions in November and December seeing swings of more than $5 between daily highs and lows, underscoring elevated volatility.
- By late 2025, price action showed frequent sharp moves around earnings and news flow, including a rise from $19.36 on 15 September to $34.68 on 31 October.
Past performance is not a reliable indicator of future results.
FAQ
Who owns the most Applied Digital stock?
Applied Digital’s share register is made up of a mix of institutional investors, company insiders and retail shareholders. Larger positions are typically held by asset managers, hedge funds and other institutional investors that access the shares through public markets, while insiders hold a smaller proportion relative to total shares outstanding. Ownership levels can change over time as funds rebalance or new investors enter, meaning published filings provide only a snapshot rather than a fixed picture.
What is the 5-year Applied Digital share price forecast?
There is no consensus five-year APLD stock forecast. Longer-term projections tend to vary widely and are inherently uncertain, particularly for companies operating in capital-intensive and fast-evolving sectors such as high-performance computing and data centres. Outcomes over a five-year horizon may depend on factors including execution, funding conditions, customer demand and broader market sentiment. Any third-party forecasts should be treated as opinions, not as reliable indicators of future performance.
Is Applied Digital a good stock to buy?
Whether Applied Digital is a 'good' stock depends on individual objectives, risk tolerance and time horizon. The company has reported rapid revenue growth linked to its data-centre expansion, but it also continues to operate at a loss and faces execution and financing risks. Share prices can be volatile as expectations shift around contracts, utilisation and funding. This content is for information only and does not constitute investment advice, and individuals should assess the risks carefully before making decisions.
Could Applied Digital stock go up or down?
Applied Digital’s share price can move both up and down, at times significantly. Positive developments such as new customer agreements, improved utilisation or supportive sector sentiment may lift prices, while disappointing results, delays, funding challenges or weaker macro conditions could weigh on the stock. As seen historically, price movements have often been volatile. For traders, this volatility may present opportunities but also increases the risk of losses, particularly when using leveraged instruments.
Should I invest in Applied Digital stock?
This article does not provide a recommendation on whether to invest in Applied Digital. Investing in individual shares involves risk, including the potential loss of capital, and suitability varies from person to person. Factors such as financial situation, experience and risk appetite all matter. Anyone considering exposure to Applied Digital should conduct their own research or seek independent professional advice, rather than relying solely on commentary, forecasts or recent price movements.
Can I trade Applied Digital CFDs on Capital.com?
Yes, you can trade Applied Digital CFDs on Capital.com. Trading share CFDs lets you speculate on price movements without owning the underlying asset and to take long or short positions. However, contracts for difference (CFDs) are traded on margin, and leverage amplifies both profits and losses. You should ensure you understand how CFD trading works, assess your risk tolerance, and recognise that losses can occur quickly.