What is shares and ETFs trading?
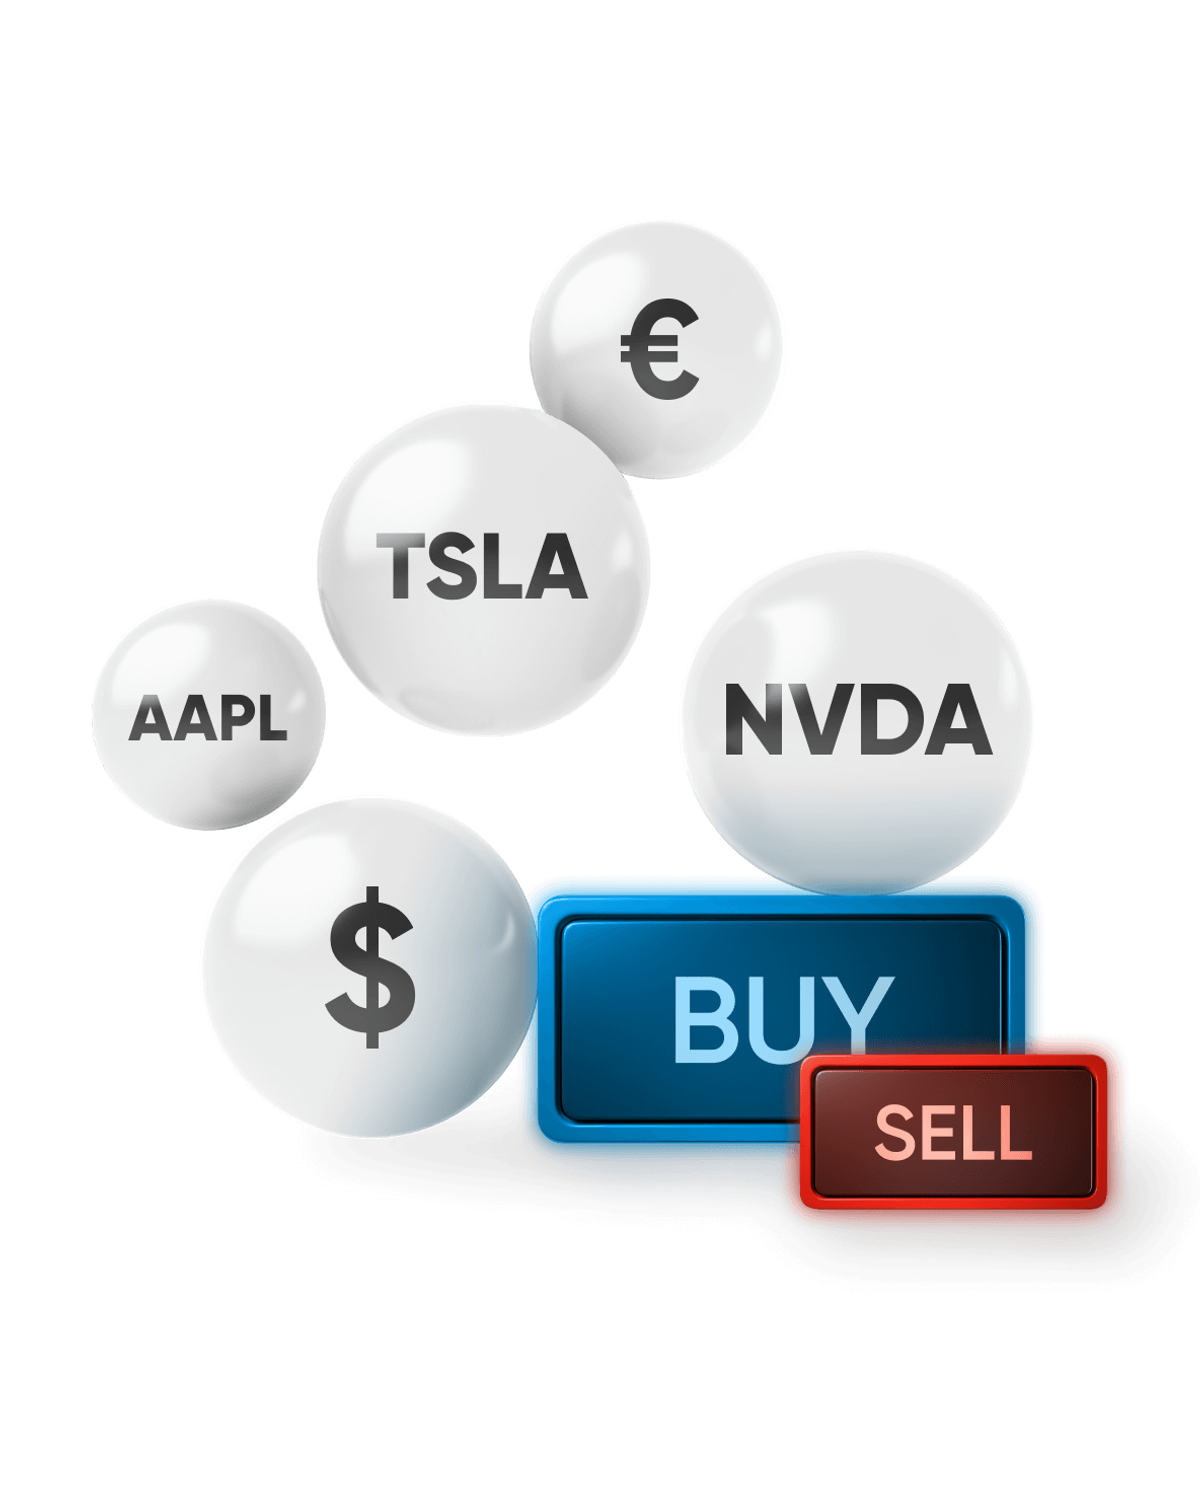
Shares and ETFs trading is the process of buying and selling individual company stocks or baskets of assets (such as ETFs), in the hope of benefitting from price fluctuations.
You can buy and sell shares or ETFs directly on a stock exchange, or trade over-the-counter (OTC) derivatives such as CFDs based on their price.
Traders generally aim to capitalise on short-term market moves. They may buy shares or ETFs they expect to go up, hold them briefly and then sell once the market rises. That differs from traditional investing, which usually involves buying and holding assets for the long term. As with all trading and investment products, there is always the possibility of loss as well as gain.
Why trade shares/ETFs?
Shares and ETFs are among the most popular markets to trade. Shares offer exposure to a single company’s performance, while ETFs track a broader selection of assets – from sectors and indices to commodities and bonds – in a single product.
Trading on shares and ETFs with CFDs gives you the opportunity to go short as well as long, without having to physically buy the underlying asset.
You can also access leverage to amplify your exposure. This can magnify your profits but also your losses, as both will be based on the full value of the position.
Why trade shares/ETFs with Capital.com?
We offer CFD trading on over 4,250 global shares and ETFs, giving you exposure to their price movements without needing to buy them outright.
We also offer extended hours on key US stocks, so you can trade on price movements around earnings announcements that are typically released after the market closes.
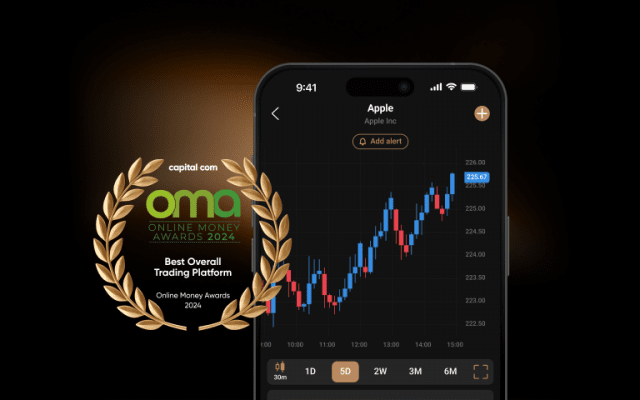
Identify potential entry and exit points with our smart, intuitive charting tools, and set price alerts to notify you of significant market moves. Protect yourself against adverse price swings with our range of risk-management tools, including trailing stops, which lock in gains while limiting losses.*
Learn more about shares trading & the differences between share trading vs cfd trading.
Stay up to date with the latest shares market news, insights and analysis.
Learn what an IPO is and how IPO trading works.
*Stop-losses are not guaranteed. Guaranteed stop-losses incur a fee if activated.