Vonovia stock forecast: Third-party price targets
Vonovia is a European residential real estate company listed in Frankfurt, with a large rental housing portfolio across Germany, Austria and Sweden. Explore third-party VNA price targets and technical analysis.
Vonovia SE (VNA) was trading around €24.36 in early European hours on 3 February 2026, with Capital.com quotes showing an intraday range between €24.33 and €24.72 as of 9:14am UTC. Past performance is not a reliable indicator of future results.
Price action comes amid ongoing attention to Vonovia’s balance sheet and cash-flow profile, after the company reported adjusted EBITDA of about €2.1 billion for the first nine months of 2025, up 6.4% year on year. This was accompanied by operating free cash flow of roughly €1.5 billion and a slight rise in the vacancy rate to 2.2% (Vonovia, 5 November 2025). The stock is also trading in the context of sector-wide interest in European listed real estate, where recent commentary has pointed to more stable asset values and renewed capital flows into property markets (Cushman & Wakefield, 4 December 2025). Regulatory disclosures on 30 January 2026 confirming a new total of 848,258,812 voting rights for Vonovia have kept corporate governance developments on investors’ radar, without signalling any change in control structures (Financial Times, 30 January 2026).
Vonovia stock forecast 2026–2030: Third-party price targets
As of 3 February 2026, third-party Vonovia stock predictions indicate a range of 12-month expectations broadly centred around the current market level, with third-party data providers aggregating broker views into average, high and low estimates for 2026. The following summaries highlight selected external forecasts published in January and February 2026, focusing on stated target prices, time horizons and underlying assumptions, rather than short-term price movements.
Berenberg (broker update)
Berenberg Bank maintains a buy rating on Vonovia with a reduced price target of €38, down from €41. The broker trims its target as it factors in updated assumptions on operating performance and sector valuation levels, reflecting shifting conditions across European real estate markets (The Globe and Mail, 28 January 2026).
TradingView (analyst consensus snapshot)
TradingView reports that the one-year consensus price target for Vonovia stands at €35.48, with a maximum estimate of €52.90 and a minimum of €26.40, based on 19 covering analysts. The platform notes that these expectations are compiled from recent analyst updates and sit alongside a blended rating derived from 20 analyst recommendations, as analysts continue to reassess Vonovia’s earnings outlook (TradingView, 28 January 2026).
Investing.com (12-month consensus update)
Investing.com reiterates that its 12-month VNA stock forecast consensus is an average target of €32.26, with individual projections ranging from €19 to €51.10, based on a poll of 18 analysts. According to the service, this spread reflects differing views on the company’s cash-flow profile and asset valuations, set against broader shifts in European property markets (Investing.com, 30 January 2026).
Predictions and third-party forecasts are inherently uncertain, as they cannot fully account for unexpected market developments. Past performance is not a reliable indicator of future results.
VNA stock price: Technical overview
The VNA stock price is trading near €24.36 as of 9:14am UTC on 3 February 2026, sitting just below a tight daily moving-average cluster. The 20-, 50-, 100- and 200-day simple moving averages are located around 24.7, 24.9, 25.7 and 27.2 respectively. The 20-day SMA currently runs slightly below the 50-day, meaning there is no short-term 20-over-50 alignment in place, and price action remains capped beneath the broader moving-average band. The 10-day SMA near 24.4 is closer to spot, while the corresponding 10-day EMA around 24.5 tracks marginally higher, reinforcing the idea of nearby technical resistance just above the current price.
On the momentum side, the 14-day RSI sits close to 46.5, placing it near the midpoint of the scale and consistent with a broadly neutral, range-bound tone rather than an extended move in either direction. The ADX, at around 20.6, also points to modest trend strength, suggesting that recent price swings have lacked a strong directional bias. On the upside, the first classic pivot resistance appears near €25.55, with €26.49 coming into view only following a sustained daily close above that initial level. On the downside, a move back through the €24.71 pivot would leave the €23.77 S1 area as the next notable reference, with this zone sitting below the main moving-average cluster (TradingView, 3 February 2026).
This technical analysis is for informational purposes only and does not constitute financial advice or a recommendation to buy or sell any instrument.
Vonovia share price history (2024–2026)
VNA’s stock price has spent much of the past two years trading in the high-€20s to low-€30s, before easing back towards the mid-€20s into early 2026. The stock closed at €29.62 on 2 January 2025 and climbed to peaks above €34 in late September and early October 2024, before trending lower through 2025. It ended that year at €24.57 on 30 December 2025. By 3 February 2026, Vonovia had closed at €24.44, leaving it well below its 2024 highs but largely confined to a narrower €24–€26 range in recent weeks.
Past performance is not a reliable indicator of future results. Share prices are indicative and may differ from live market prices.
Vonovia (VNA): Capital.com analyst view
Vonovia’s share price has eased back into the mid-€20s in early 2026 after trading closer to the low-€30s for parts of 2024, reflecting a cooler phase following an earlier recovery in European real estate stocks. As Europe’s largest private residential landlord, the company’s share price tends to respond to expectations around rental demand, regulation and funding conditions, meaning even relatively modest shifts in interest-rate or policy sentiment can be reflected in price movements.
One supportive consideration is that persistent housing demand, high occupancy rates and limited new supply in key markets such as Germany and Austria may help underpin cash flows. Sector research has also pointed to improving transaction activity across European residential property. On the other hand, Vonovia remains exposed to interest-rate and refinancing risk, political scrutiny of large landlords and potential valuation swings if property yields adjust, all of which could influence the share price even if rental operations remain broadly stable.
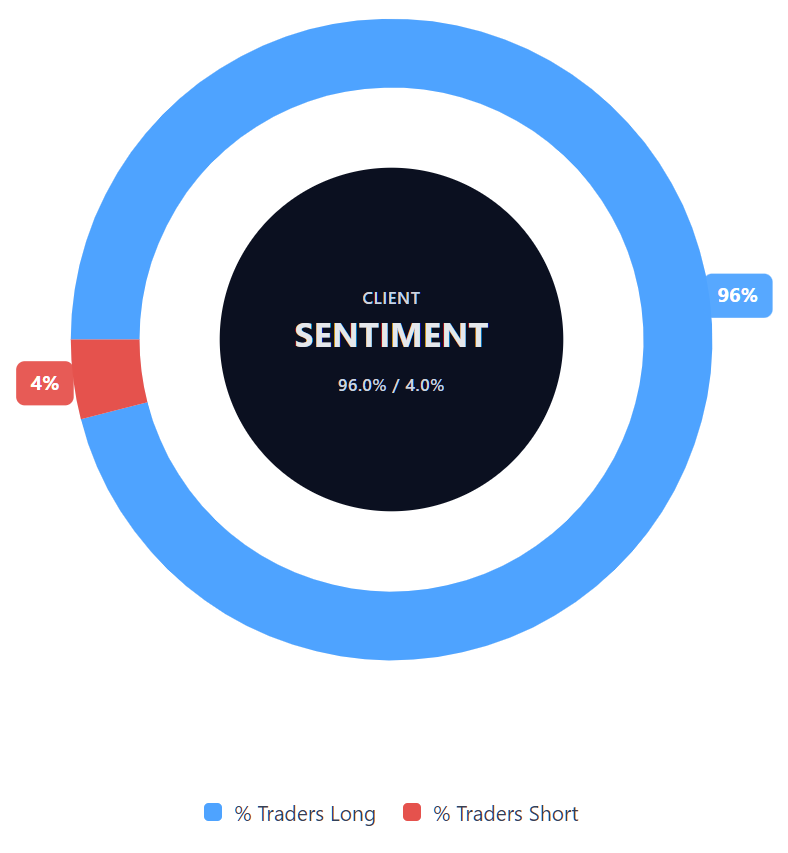
Capital.com’s client sentiment for Vonovia CFDs
As of 3 February 2026, Capital.com client positioning in Vonovia CFDs currently stands at 96% buyers versus 4% sellers, indicating a heavily one-sided tilt towards long positions and placing buyers ahead by 92 percentage points. This snapshot reflects open positions on the Capital.com platform and may change as market conditions evolve.
Summary – Vonovia 2026
- Vonovia traded mostly in the high-€20s to low-€30s during 2024 before moving into the mid-€20s range by early 2026.
- In 2025, the share price peaked above €34 and then moved lower over the course of the year, ending at around €24.57, well below earlier highs.
- Latest Capital.com quote data show Vonovia trading near €24.36 on 3 February 2026, with an intraday range of approximately €24.33 to €24.72.
- Technical indicators point to a broadly neutral momentum backdrop, with the price trading below clustered 20-, 50-, 100- and 200-day moving averages in the mid- to high-€20s.
Past performance is not a reliable indicator of future results.
FAQ
Who owns the most Vonovia stock?
Vonovia has a widely distributed shareholder base, typical of a large European listed real estate company. Its largest shareholders are institutional investors such as asset managers, pension funds and insurance groups, rather than a single controlling owner. These holdings can change over time as institutions rebalance portfolios or respond to market conditions. Regulatory filings provide periodic updates on major shareholdings, and current disclosures do not point to any dominant shareholder with outright control.
What is the five-year Vonovia share price forecast?
There is no single, definitive five-year VNA stock forecast. Most publicly available projections focus on shorter horizons, typically around 12 months, and reflect analysts’ assumptions at the time they are published. Longer-term outcomes depend on factors such as interest rates, property valuations, rental regulation, refinancing conditions and broader economic trends. As with all listed equities, longer-term projections are inherently uncertain and may change as new information emerges.
Is Vonovia a good stock to buy?
Whether Vonovia is considered attractive depends on individual objectives, time horizons and risk tolerance. Some investors focus on its scale, residential portfolio and rental income profile, while others place greater weight on its exposure to interest rates, debt levels and regulatory pressures. Different market participants may draw different conclusions from the same set of information. This discussion is for general information only and does not represent a recommendation to buy or sell Vonovia shares.
Could Vonovia stock go up or down?
Like all listed equities, Vonovia’s share price can move in either direction. Changes in interest rate expectations, property market sentiment, earnings updates or regulatory developments can influence price movements, alongside broader market conditions and shifts in investor risk appetite. Past price behaviour does not provide a reliable indication of future performance, and periods of price volatility are a normal feature of equity markets.
Should I invest in Vonovia stock?
Deciding whether to invest in Vonovia involves assessing personal financial circumstances, risk appetite and investment goals. Shares in real estate companies can provide exposure to rental markets but may also carry risks linked to leverage, property valuations and policy changes. The information provided here is general in nature and does not take individual circumstances into account. You may wish to seek independent financial advice before making any investment decisions.
Can I trade Vonovia CFDs on Capital.com?
Yes, you can trade Vonovia CFDs on Capital.com. Trading share CFDs lets you speculate on price movements without owning the underlying asset and to take long or short positions. However, contracts for difference (CFDs) are traded on margin, and leverage amplifies both profits and losses. You should ensure you understand how CFD trading works, assess your risk tolerance, and recognise that losses can occur quickly.