UK 100 forecast: US–UK pharma deal, FTSE returns
The UK 100 tracks the FTSE 100 and, in April 2026, remained near recent highs as markets assessed a new US–UK pharmaceutical trade deal and projected shareholder returns. Past performance is not a reliable indicator of future results. Explore third-party UK100 predictions and technical analysis.
The FTSE 100 index – referred to as the UK 100 (UK100) on CFD trading platforms such as Capital.com – was last quoted at 10,577.1 on Capital.com's feed at 2:59pm UTC on 13 April 2026, trading within a Monday session intraday range of 10,496.4–10,643.6. Past performance is not a reliable indicator of future results.
Sentiment has been underpinned by a series of trade-related developments. The UK finalised the legal text of a US–UK pharmaceutical trade deal on 2 April 2026, securing zero tariffs on British medicine exports to the US for at least three years, while the NHS agreed to raise net prices paid for new medicines by 25% (Reuters, 2 April 2026). The deal, which also covers medical technology, was cited by Business and Trade Secretary Peter Kyle as evidence of the 'tangible benefits' of the UK–US Economic Prosperity Deal (GOV.UK, 2 April 2026). Broader global tariff uncertainty has continued to weigh on risk appetite across European markets (export.org.uk, 7 April 2026).
AJ Bell noted that FTSE 100 companies are on track to deliver a record £88bn in dividends and £29.4bn in share buybacks in 2026. This would amount to a combined cash return of approximately £117.4bn, equivalent to 4.4% of the index's £2.7 trillion market capitalisation, a figure AJ Bell suggests may continue to support the index's relative valuation (Yahoo Finance, 1 April 2026).
UK 100 forecast 2026–2030: Third-party targets
As of 13 April 2026, third-party UK 100 predictions reflect diverging assumptions on Bank of England policy, global energy prices, earnings growth, and the evolving US tariff landscape. The following targets summarise leading third-party projections captured within that window.
Investing.com (Q2 2026 equities outlook)
Investing.com's Q2 2026 equities forecast identifies the UK 100 as the strongest relative performer among major Western indices for the quarter, citing near-term resistance at 10,400, a downside rotation scenario towards 9,250, and a medium-term upside scenario of 11,250 should macro conditions stabilise. The analysis notes that the index's structural exposure to energy, commodities, and defensive sectors provides a buffer in a sticky-inflation environment, while stalled Bank of England rate-cut expectations cap any sustained breakout (Investing.com, 2 April 2026).
Motley Fool UK (UBS scenario summary)
Drawing on UBS's latest scenario analysis, Motley Fool UK reports a base-case target of 10,500 for the UK 100 by December 2026, a bull-case target of 11,300 driven by further rate cuts and elevated commodity prices, and a bear-case level of 7,200 in the event of an escalation in the Iran conflict and a reversal of monetary easing. The piece frames UBS's base case as broadly flat relative to current trading levels, with sector rotation towards defensive names such as consumer staples cited as a likely feature of the year ahead (Motley Fool UK, 13 April 2026).
Long Forecast (monthly algorithmic model)
Long Forecast's rolling quantitative model projects the UK 100 to close April 2026 at approximately 10,345, within a monthly range of 9,052–11,069, before recovering to 11,040 by the end of May and extending towards 12,871 by December 2026. The model is driven by trend extrapolation rather than fundamental inputs, with the April close implying a marginal 0.2% monthly change from the March close of 10,325 (Long Forecast, captured 13 April 2026).
CoinPriceForecast (long-range model)
CoinPriceForecast's rolling model projects the UK 100 reaching 11,490 by mid-2026 and 11,803 by year-end 2026, extending further to 12,710 by the end of 2027. The model uses a proprietary machine-learning methodology applied to historical price trends, with the mid-2026 target implying approximately 8.6% upside from the 13 April 2026 last close of 10,577.1 (CoinPriceForecast, 12 April 2026).
MoneyMagpie (consensus range overview)
MoneyMagpie's forecast overview aggregates institutional and model-based estimates into a bear case of approximately 9,500–10,000, a base case of 10,000–11,500, and a bull case of 12,000 or above by year-end. The piece attributes more optimistic scenarios to sustained earnings support, continued Bank of England rate cuts, and a favourable global trade backdrop, while noting that conservative institutional targets, including UBS's base case of around 10,000 and a more optimistic scenario of approximately 10,800 at the time of that institution's original publication, had already been surpassed by the time of writing (MoneyMagpie, 7 April 2026).
Predictions and third-party forecasts are inherently uncertain, as they cannot fully account for unexpected market developments. Past performance is not a reliable indicator of future results.
UK100 index price: Technical overview
The UK100 index last closed at 10,577.1 at 2:59pm UTC on 13 April 2026, trading above the full stack of daily simple moving averages, with the 20-, 50-, 100-, and 200-day SMAs sitting at approximately 10,251, 10,397, 10,140, and 9,712 respectively. All were returning buy signals as of 13 April 2026, 2:59pm UTC, per TradingView. The 20-over-50 SMA alignment is intact, consistent with a constructive short-term trend structure. The Hull moving average (9) at 10,680.1 is the sole moving average reading above the last close, returning a sell signal and indicating that the index may be losing near-term momentum relative to that faster indicator.
The 14-day relative strength index reads 60.15, placing momentum in the upper-neutral range and suggesting neither overbought nor oversold conditions at current levels. The average directional index (14) at 24.68 sits just below the 25 threshold, implying that the prevailing trend has limited but developing directional strength.
On the upside, the classic R1 pivot at 10,834.8 is the nearest reference above the last close; a daily close above that level could put R2 at 11,493.2 in view. On pullbacks, the classic pivot point at 10,252.6 represents initial support, with the 100-day SMA shelf near 10,139.8 as the next meaningful level. A move below that shelf could bring S1 at 9,594.3 into view (TradingView, 13 April 2026).
This is technical analysis for informational purposes only and does not constitute financial advice or a recommendation to buy or sell any instrument.
UK 100 index history (2024–2026)
The UK 100 index is a contract for difference (CFD) tracking the FTSE 100, an index of the 100 largest companies listed on the London Stock Exchange, weighted by market capitalisation.
The index entered 2025 at 8,156.2 and spent much of the first quarter trading in a narrow band before US tariff announcements triggered a sharp sell-off. The index fell to a closing low of 7,666.9 on 8 April 2025, its weakest point in the dataset, before rebounding strongly as sentiment stabilised. From that trough, UK100 gained approximately 41.7% to reach its dataset peak of 10,866.2 on 27 February 2026, as easing monetary policy expectations and resilient corporate earnings supported a sustained recovery. The index closed 2025 at 9,933.0, up approximately 21.8% year on year.
In 2026, the index hit its record high of 10,866.2 on 27 February before pulling back 9.2% to a 2026 low of 9,867.2 on 29 March, amid renewed trade policy uncertainty. A recovery followed, and UK100 closed at 10,579.6 on 13 April 2026, up approximately 6.4% year to date and approximately 30.2% year on year.
Past performance is not a reliable indicator of future results. Share prices are indicative and may differ from live market prices.
UK 100 (UK100): Capital.com analyst view
The UK 100's trajectory over the past two years reflects both the resilience of the FTSE 100's defensive and commodity-heavy composition and its vulnerability to global macro shifts. The index posted gains of approximately 21.8% through 2025, supported by four Bank of England rate cuts and record FTSE 100 corporate profits. In 2026, the index briefly broke above the 10,800 level before pulling back sharply to the 9,867 area in late March amid uncertainty related to the Iran conflict and a recalibration of rate-cut expectations. The recovery to current levels near 10,580 illustrates the index's relative appeal as a more defensive market within global equities; however, that same defensiveness may limit upside if risk appetite returns more broadly to global markets.
Looking ahead, the Bank of England rate path remains a key variable. A resumption of cuts could support domestic-facing constituents and dividend-paying stocks; conversely, sticky inflation or geopolitical escalation could prompt a hold or even a reversal, pressuring valuations. The FTSE 100's international earnings exposure also means sterling movements cut both ways: a stronger pound could weigh on overseas revenues reported in GBP, while weakness could provide a tailwind. The concentration of recent outperformance in a narrow band of stocks, as noted by Panmure Gordon, adds a further layer of risk to index-level momentum.
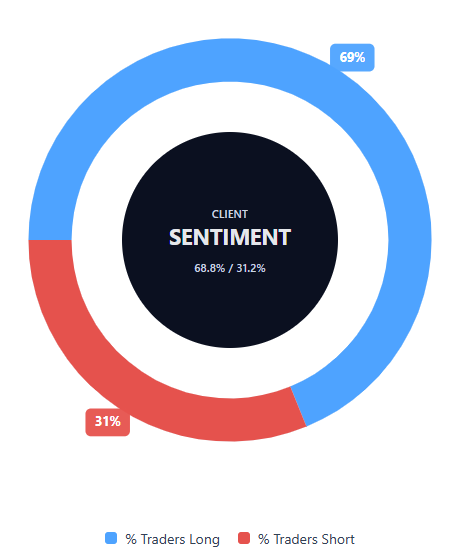
Capital.com’s client sentiment for UK 100 CFDs
As of 13 April 2026, Capital.com client positioning in UK 100 CFDs shows 68.8% of open positions long against 31.2% short, which places sentiment firmly in majority-buy territory, although shy of an extreme. The skew reflects a broadly bullish lean among active clients on the platform, without yet reaching the one-sided readings typically associated with heavily crowded positioning. This snapshot reflects open positions on Capital.com at the time of writing and can change rapidly as market conditions evolve.
Summary – UK 100 2026
- As of 2:59pm UTC on 13 April 2026, UK 100 (UK100) was last quoted at 10,577.1, up approximately 6.4% year to date and 30.2% year on year.
- Key price drivers include Bank of England rate policy, UK–US pharmaceutical trade deal developments, global tariff uncertainty, and sterling movements affecting international earnings.
- The index's defensive and commodity-heavy composition has supported relative outperformance versus US growth indices, though concentration in a narrow range of stocks adds index-level risk.
Past performance is not a reliable indicator of future results.
FAQ
What is the 5 year UK 100 forecast?
Is UK 100 a good CFD to trade?
Could UK 100 go up or down?
Yes. The UK 100 can rise or fall in response to company earnings, interest-rate expectations, commodity prices, sterling moves, geopolitical events and wider investor sentiment. Technical indicators and forecasts may suggest possible scenarios, but markets can move unexpectedly.