Thyssenkrupp stock forecast: Analysts adjust targets after FY2026 earnings
Thyssenkrupp AG is a Germany-based industrial and engineering group listed in Frankfurt, with activities across steel, materials services and technology segments that expose its share price to corporate and macroeconomic developments. Explore third-party TKA price targets and technical analysis.
Thyssenkrupp AG (TKA) is trading around €10.81 as of 3:02pm UTC on 19 February 2026, moving within an intraday range between €10.56 and €10.93 on Capital.com’s platform. Past performance is not a reliable indicator of future results.
The stock trades amid reports that Thyssenkrupp is exploring strategic options for its Materials Services division, including a potential spin-off, listing or divestment, as part of a broader corporate overhaul under CEO Miguel Lopez (Reuters, 18 February 2026). These discussions follow earlier steps such as the separation of its defence business and ongoing talks regarding its steel unit (Reuters, 9 December 2025). The group’s latest quarterly update for the 2025/2026 financial year showed lower sales but higher EBIT compared with the prior-year period (Yahoo Finance, 12 February 2026).
Thyssenkrupp stock forecast 2026–2030: Third-party price targets
As of 19 February 2026, third-party Thyssenkrupp stock predictions reflect differing assumptions about restructuring progress, steel-cycle dynamics and European industrial demand. Analyst targets are indicative, can change at short notice and do not represent guarantees or investment recommendations.
J.P. Morgan (investment bank update)
J.P. Morgan maintains a neutral rating on Thyssenkrupp while trimming its 12-month price target from €11.10 to €10 following a sector review. The bank cites a less favourable risk-reward profile after recent share gains and continued uncertainty around the timing and financial impact of planned portfolio measures (MarketScreener, 18 February 2026).
Jefferies (broker research)
Jefferies retains a neutral stance on Thyssenkrupp, with a 12-month target near €11. The broker incorporates potential benefits from restructuring and asset measures, while highlighting cyclical exposure to steel and capital goods end-markets (MarketScreener, 12 February 2026).
Fintel (consensus snapshot)
Fintel shows an average 12-month TKA stock forecast of around €11.59, with individual analyst estimates ranging from €8.79 to €14.70. The dispersion reflects varying assumptions about balance-sheet repair, portfolio streamlining and the trajectory of European steel and industrial demand (Fintel, 19 February 2026).
Yahoo Finance (analyst target range)
Yahoo Finance reports an average one-year Thyssenkrupp target of approximately €11.68, with a low estimate of €8.70 and a high of €15. The platform aggregates multiple analyst models that incorporate margin expectations, restructuring milestones and broader market conditions (Yahoo Finance, 19 February 2026).
Predictions and third-party forecasts are inherently uncertain, as they cannot fully account for unexpected market developments. Past performance is not a reliable indicator of future results.
TKA stock price: Technical overview
The TKA stock price is trading around €10.81 as of 3:02pm UTC on 19 February 2026, with price positioned just below a tight daily moving-average cluster. The 20-, 50-, 100- and 200-day simple moving averages (SMAs) sit near €11.24, €10.31, €9.63 and €8.08 respectively. The 50- and 100-day averages remain above the 200-day line, while the 10-day SMA near €11.25 and the volume-weighted moving average (VWMA) around €11.22 define the immediate area that price is testing from below.
The 14-day relative strength index (RSI) stands close to 49, placing it in neutral territory. The average directional index (ADX), near 19, points to a modest trend environment, consistent with range-bound conditions rather than a sustained directional phase.
On the upside, the nearest classic pivot resistance (R1) appears around €12.13, with R2 near €12.98 coming into focus only if price achieves a sustained daily close above the first level. On the downside, the classic pivot near €10.78 acts as initial support, followed by S1 around €9.93 and the 100-day SMA near €9.63 as a further reference point. A decisive move below the 100-day average could expose lower support zones in the high-€9 area, while holding above the pivot keeps the recent consolidation band intact around the short- and medium-term averages (TradingView, 19 February 2026).
This technical analysis is provided for informational purposes only and does not constitute financial advice or a recommendation to buy or sell any instrument.
Thyssenkrupp share price history (2024–2026)
Over the past two years, TKA’s stock price has moved from roughly €3.20–€4 in late 2024 to above €10 by early 2026, with periods of heightened volatility along the way. The stock closed near €5.81 on 19 February 2025 before trending higher through the remainder of the year, ending December 2025 just under €9.33.
Momentum increased in early 2026, with price rising from around €9.71 at the start of January to approximately €10.88 by 19 February 2026. During this period, the stock briefly traded above €12 in early February before pulling back. Across the two-year window, shares have risen more than threefold from late-2024 levels, while exhibiting sizeable interim swings that illustrate the variability inherent in equity markets.
Past performance is not a reliable indicator of future results. Share prices are indicative and may differ from live market prices.
Thyssenkrupp (TKA): Capital.com analyst view
Thyssenkrupp’s share price has recovered from low single-digit levels in early 2025 to trade in the €10–€12 range in early 2026, with recent sessions showing wider intraday ranges. Market participants appear to be reassessing the group’s restructuring plans, balance-sheet initiatives and exposure to European industrial and steel cycles.
From one perspective, portfolio adjustments and cost measures could support operational efficiency if executed as planned. From another, delays, cost pressures or softer macroeconomic data could weigh on earnings visibility and contribute to further volatility. News relating to asset disposals, earnings releases or sector developments has recently coincided with sharp moves in both directions, underscoring how price reactions can depend on how outcomes compare with prior expectations.
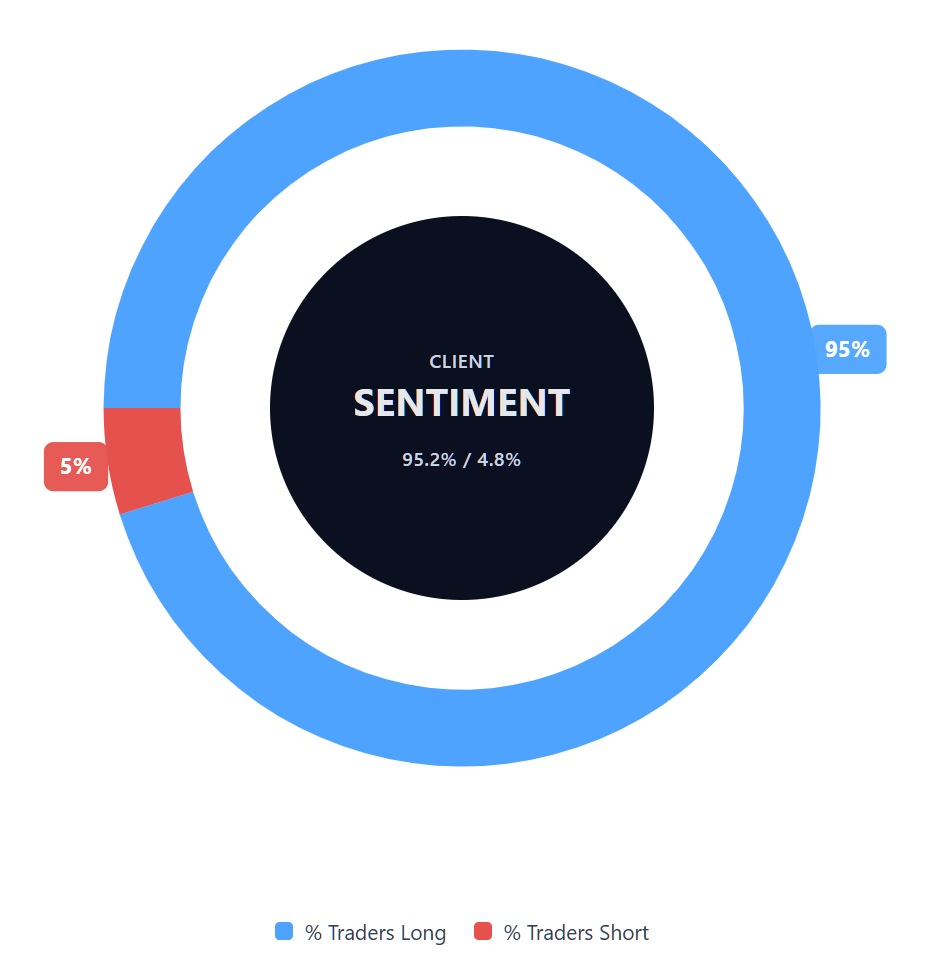
Capital.com’s client sentiment for Thyssenkrupp CFDs
As of 19 February 2026, Capital.com client positioning in Thyssenkrupp CFDs shows 95.2% of open CFD positions held long and 4.8% held short, leaving buyers ahead by roughly 90 percentage points. This distribution reflects a pronounced long bias at the time of writing. Client sentiment can change quickly and represents open positions on Capital.com’s platform only.
Summary – Thyssenkrupp 2026
- Thyssenkrupp’s share price moved from around €3–€4 in late 2024 to close 2025 just under €9.33, marking a substantial two-year rebound.
- By 19 February 2026, the stock traded near €10.88, after briefly exceeding €12 earlier in the month, highlighting broader trading ranges compared with prior periods.
- Daily technical indicators place price just below a cluster of short- and medium-term moving averages around €10–€11. The RSI sits in neutral territory, while the ADX suggests a modest trend environment.
- Potential price drivers include developments in Thyssenkrupp’s restructuring strategy, changes in European steel and industrial demand, and broader movements in German and eurozone equity markets.
- Recent reporting on potential portfolio adjustments and strategic options for parts of the business has coincided with increased price variability, with market reactions shaped by how new information aligns with existing expectations.
Past performance is not a reliable indicator of future results.
FAQ
Who owns the most Thyssenkrupp stock?
Thyssenkrupp’s largest shareholder has historically been the Alfried Krupp von Bohlen und Halbach Foundation, which holds a significant strategic stake in the company. As with many listed firms, institutional investors, asset managers and retail shareholders also hold shares. Ownership structures can change over time due to market transactions and corporate actions, so investors usually consult the latest regulatory filings and company disclosures for the most up-to-date breakdown.
What is the five-year Thyssenkrupp share price forecast?
There is no single, agreed five-year TKA stock forecast. Most publicly available analyst targets focus on a 12-month horizon rather than longer-term projections. Over a five-year period, performance would likely depend on restructuring progress, steel-cycle conditions, European industrial demand and broader macroeconomic factors. Longer-term forecasts are inherently uncertain and analysts may revise them as company fundamentals and market conditions change.
Is Thyssenkrupp a good stock to buy?
Whether Thyssenkrupp is considered suitable depends on an individual’s objectives, risk tolerance and time horizon. The company operates in cyclical sectors such as steel and industrial services and is undergoing structural changes, which can contribute to variability in earnings and share price. Investors often review financial results, balance-sheet strength, competitive positioning and sector outlook before making decisions. This information is provided for general awareness and does not constitute investment advice.
Could Thyssenkrupp stock go up or down?
Like any listed equity, Thyssenkrupp’s share price can move in either direction. Restructuring developments, earnings releases, steel prices, macroeconomic data and sentiment in German and broader European equity markets may influence valuation. Technical levels and positioning can also affect shorter-term fluctuations. Past performance is not a reliable indicator of future results, and volatility may increase around corporate announcements or sector-specific developments.
Should I invest in Thyssenkrupp stock?
Any decision to invest in Thyssenkrupp shares involves assessing your financial situation, investment goals and capacity for risk. Equities can provide exposure to company performance but also carry the risk of capital loss, particularly in cyclical industries. Some market participants use products such as CFDs to gain exposure to price movements; however, CFDs are leveraged instruments and involve additional risk. You may wish to seek independent financial advice before making any investment decision.
Can I trade Thyssenkrupp CFDs on Capital.com?
Yes, you can trade Thyssenkrupp CFDs on Capital.com. Trading share CFDs lets you speculate on price movements without owning the underlying asset and to take long or short positions. However, contracts for difference (CFDs) are traded on margin, and leverage amplifies both profits and losses. You should ensure you understand how CFD trading works, assess your risk tolerance, and recognise that losses can occur quickly.