S&P 500 index forecast: ISM beat, ceasefire hopes, tariff risk
The US 500 traded higher on 1 April as March ISM manufacturing data beat forecasts, while reports of a potential Middle East ceasefire were offset by caution ahead of US tariff news. Past performance is not a reliable indicator of future results. Explore third-party US500 targets and technicals.
The S&P 500 index – referred to as the US 500 (US500) on CFD trading platforms such as Capital.com – was trading at $6,601.0 on Capital.com's quote feed as of 5:11pm UTC on 1 April 2026, near the intraday high of $6,603.6 and well above the session low of $6,322.5. Past performance is not a reliable indicator of future results.
Sentiment was supported by several converging factors on 1 April. The ISM Manufacturing PMI for March rose to 52.7, beating a consensus estimate of 52.5 and reaching its highest reading since August 2022, with production expanding to 55.1 (Trading EConomics, 1 April 2026). Markets had also priced in improved geopolitical risk sentiment after reports of a potential Middle East ceasefire, which Saxo Bank said lifted US equities broadly alongside a pullback in oil prices and a cooling US dollar. At the same time, the looming 2 April tariff announcement from the Trump administration kept the backdrop cautious, with options markets pricing approximately an 84-point move (around 1.3%) in the S&P 500 into that expiry, reflecting sustained hedging activity ahead of the event (Saxo Bank, 1 April 2026).
US 500 forecast 2026–2030: Third-party targets
As of 1 April 2026, third-party US 500 predictions reflect a wide spread of year-end targets, shaped primarily by the Middle East conflict, the resulting oil-price shock, Federal Reserve policy expectations, and the trajectory of corporate earnings.
J.P. Morgan (revised year-end target)
J.P. Morgan cut its 2026 year-end S&P 500 target to 7,200 from a prior 7,500, while also flagging a potential near-term slide to 6,000 if the Middle East conflict intensifies further. The bank, as cited by Investing.com, warned that markets were underestimating risks from surging oil prices and investor complacency around the assumption that any oil-price spike would be short-lived (Investing.com, 19 March 2026).
Goldman Sachs (reaffirmed base case)
Goldman Sachs reiterated its year-end 2026 S&P 500 target of 7,600, implying approximately 14% upside from levels at the time of publication, with earnings per share projected at $309 in 2026 and $342 in 2027. Strategists cite a broadening of profit growth beyond large-cap technology and a still-expanding economy as the primary supports, while outlining a downside path to 5,400 in a severe oil-shock or recession scenario (TheStreet, 17 March 2026).
CNBC (strategist survey)
CNBC's 2026 market strategist survey shows the average Wall Street year-end S&P 500 target at approximately 7,600, with individual estimates ranging from Bank of America Merrill Lynch's 7,100 at the low end to Deutsche Bank's 8,000 at the high end. The dispersion reflects divergent views on how long oil prices remain elevated and whether the Federal Reserve retains sufficient room to ease policy amid sticky inflation (CNBC, 19 March 2026).
Predictions and third-party forecasts are inherently uncertain, as they cannot fully account for unexpected market developments. Past performance is not a reliable indicator of future results.
US500 index price: Technical overview
The US500 index last traded at $6,601.0 as of 5:11pm UTC on 1 April 2026, sitting just below its 20-day simple moving average (SMA) at around $6,622 and well beneath the 50- and 100-day SMAs at around $6,790 and $6,810, according to TradingView data. The majority of moving averages carry a sell signal across the 20- to 100-day tenors, while the short-term 10-day SMA at around $6,516 reads buy, reflecting the recent bounce from intraday lows. The Hull moving average (9) at around $6,443 also reads buy, consistent with near-term price action recovering from the session's $6,322.5 low.
Momentum is mixed to soft: the 14-day relative strength index sits at 47.3, a mid-range neutral reading, while the average directional index at 40.1 indicates an established trend is in force, per TradingView. The MACD (12, 26) level of -92.73 reads sell, adding a cautionary note to the near-term picture.
On the classic pivot framework, the pivot point at $6,582.2 acts as an initial reference support; below there, S1 near $6,263.3 is the next meaningful level. On the upside, R1 at $6,847.4 would come back into view on a sustained daily close above the 20-day SMA cluster near $6,607–$6,622; R2 at $7,166.3 is a broader reference beyond that. The 200-day SMA at around $6,642 sits just above last price and may act as a near-term overhead reference alongside the EMA cluster (TradingView, 1 April 2026).
This is technical analysis for informational purposes only and does not constitute financial advice or a recommendation to buy or sell any instrument.
US 500 index history (2024–2026)
The US 500 index tracks the S&P 500, a market-capitalisation-weighted index of 500 large-cap US-listed companies, widely regarded as a benchmark for the broader American equity market.
The index opened April 2024 near $5,206, then added roughly 13% through the remainder of that year to close 2024 at $5,882.7 on 31 December. Momentum carried into 2025: the index climbed steadily to a session high of $7,002.9 on 3 February 2026, briefly crossing the $7,000 mark for the first time in the dataset.
The sharpest disruption in the two-year window came in early April 2025, when the index fell from $5,639.1 on 1 April 2025 to an intraday low of $4,808.4 on 7 April 2025 – a drop of around 14.7% in under a week – amid a broad market sell-off. A swift recovery followed: by 9 April 2025, the index had clawed back to $5,479.6, and by mid-May 2025 it had returned to the $5,800s. The index went on to close 2025 at $6,848.1 on 31 December, up approximately 16.4% on the year.
2026 opened near those highs before moving lower through March, with the index pulling back roughly 5.1% from its 2 March high of $6,901.2 to close March at $6,547.3. US 500 closed at $6,601.5 on 1 April 2026, which is approximately 3.7% down year to date, but 17.1% up year on year.
Past performance is not a reliable indicator of future results. Share prices are indicative and may differ from live market prices.
US 500 (US500): Capital.com analyst view
The US 500's performance over the past two years reflects a market navigating sharply contrasting conditions. The index gained approximately 16.4% across 2025, driven by AI-related earnings momentum, a broadening of profit growth beyond mega-cap technology, and resilient consumer spending, according to J.P. Morgan and Goldman Sachs data. That advance was not linear: the index shed roughly 14.7% in under a week during early April 2025 following sweeping tariff announcements before staging a strong recovery, illustrating how quickly sentiment can shift when policy risk crystallises.
Heading into Q2 2026, the picture is more mixed. The S&P 500 closed Q1 2026 down approximately 4.3%, as the Iran conflict and a related oil-price shock weighed on sentiment, with growth and value stocks declining together – a sign of broad macro de-risking rather than style rotation, as noted by Nasdaq's March 2026 review. On the more constructive side, S&P 500 Q1 earnings per share growth is forecast to extend a run of six consecutive double-digit quarters, and forward revenues are projected to rise 9.7% year on year. However, the index's forward price-to-earnings ratio near 19.9x and a Shiller CAPE above 40 leave less room for earnings disappointment, and any escalation in geopolitical risk or a more restrictive Federal Reserve stance could weigh on valuations from current levels.
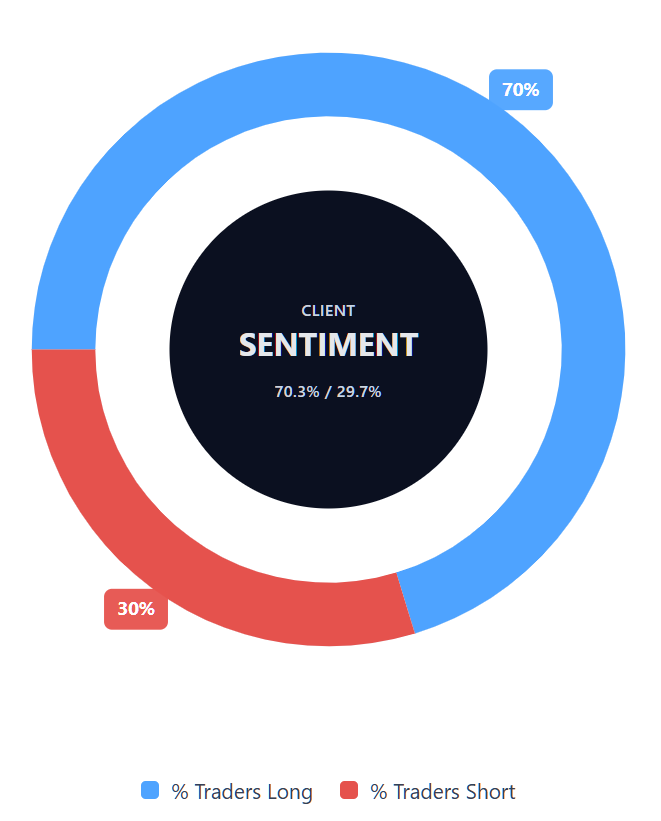
Capital.com’s client sentiment for US 500 CFDs
As of 1 April 2026, Capital.com client positioning in US 500 CFDs stands at 70.3% buyers and 29.7% sellers, putting buyers ahead by 40.5 percentage points, which places current sentiment in heavily long and one-sided territory. This snapshot reflects open positions on Capital.com and can change rapidly in response to market conditions.
Summary – US 500 2026
- US 500 last traded at $6,601.0 as of 5:11pm UTC on 1 April 2026, down approximately 3.7% year to date but 17.1% up year on year.
- The ADX at 40.1 indicates an established trend is in force, while the MACD remains negative, suggesting near-term momentum has not yet confirmed a sustained recovery.
- Key upside drivers include resilient US earnings growth, AI productivity tailwinds, and a broadening of profit growth beyond large-cap technology stocks.
- Key risks include the Iran conflict, elevated oil prices, a restrictive Federal Reserve, and a stretched forward price-to-earnings ratio near 19.9x.
Past performance is not a reliable indicator of future results.
FAQ
What is the 5 year US 500 forecast?
Is US 500 a good CFD to trade?
Whether US 500 is a good CFD to trade depends on a trader’s objectives, risk tolerance, time horizon and understanding of leveraged products. The index is widely followed, highly liquid and closely linked to major macroeconomic and earnings developments, which can make it relevant for a range of trading styles. At the same time, CFDs are complex instruments and losses can exceed expectations if volatility rises or risk management is not used carefully.
Could US 500 go up or down?
US 500 could move in either direction depending on how key drivers develop. Supportive factors may include stronger corporate earnings, resilient economic data and improving risk sentiment. On the other hand, pressure could come from higher oil prices, geopolitical tensions, tighter monetary policy or weaker-than-expected earnings. As the article shows, analyst views remain mixed, so price action will likely depend on how these competing forces evolve rather than on any single factor.
Should I invest in US 500?
Can I trade US 500 CFDs on Capital.com?
Yes, you can trade US 500 CFDs on Capital.com. Trading index CFDs lets you speculate on price movements without owning the underlying asset and to take long or short positions. However, contracts for difference (CFDs) are traded on margin, and leverage amplifies both profits and losses. You should ensure you understand how CFD trading works, assess your risk tolerance, and recognise that losses can occur quickly.