Solana price prediction: Fed meeting, rate-cut delay
Solana (SOL) trades near $90 on 13 March 2026 as markets watch the Fed’s 17–18 March meeting, Goldman’s delayed rate-cut call, and Solana’s planned Alpenglow upgrade. Past performance is not a reliable indicator of future results. Explore third-party SOL price targets and technical analysis.
Solana (SOL/USD) is trading at $90.92 on the Capital.com platform as of 12:52pm UTC on 13 March 2026, having touched an intraday high of $91.38 and pulled back slightly from that level. Past performance is not a reliable indicator of future results.
Prices have found support amid a broader macro recalibration as the Federal Reserve’s policy meeting on 17–18 March approaches. Goldman Sachs reported on 12 March 2026 that it had pushed back its first expected Fed rate cut to September 2026 while raising its headline PCE forecast to 2.9% by year-end, adding caution to risk-asset sentiment (Reuters, 12 March 2026). Friday’s release of the PCE inflation index (often described as the Fed’s preferred inflation gauge) is also in focus, with a Reuters poll anticipating a 0.2% monthly rise in inflation (Reuters, 12 March 2026), while any upside surprise could tighten liquidity conditions further for high-beta assets, including cryptocurrencies. On the protocol side, Solana’s Alpenglow consensus upgrade, targeting transaction finality of 100–150 milliseconds and scheduled for the first half of 2026, continues to be cited by market participants as a structural development for the network’s institutional positioning (TradingView, 6 September 2025)
Solana price prediction 2026-2030: Analyst price target view
As of 12 March 2026, third-party SOL price predictions reflect diverging assumptions on macro conditions, on-chain activity, memecoin ecosystem health, and the Alpenglow consensus upgrade.
BeInCrypto (March technical scenario)
BeInCrypto identifies $80 as the most critical near-term support level for SOL in March 2026, with a confirmed head-and-shoulders pattern on the three-day chart pointing to a measured-move target of $59 if that level breaks, while a reclaim of $96 and then $116 would be required to signal structural recovery (BeInCrypto, 27 February 2026).
Changelly (monthly model)
Changelly places SOL’s March 2026 range between a floor of $85.43 and a peak of $95.56, with an average of $90.50, and sees the token moving into an April channel of $100.37–$102.51 amid a projected improvement in near-term sentiment. The model incorporates four-hour and daily moving average signals, noting that the 200-day moving average on the four-hour chart has been rising since 9 March 2026, indicating a tentative improvement in the longer-term trend even as shorter-term signals remain soft (Changelly, 12 March 2026).
CoinCodex (algorithmic 2026 range)
CoinCodex projects a 2026 full-year trading channel of $90.05–$132.94 for SOL, with a modelled end-of-year price of $123.56. The algorithm reflects Bitcoin halving cycle dynamics and historical price volatility, with 20 of 29 technical indicators currently reading bearish and the 14-day RSI sitting at 48.75, placing the market in a neutral position as of the same date (CoinCodex, 13 March 2026).
Pintu News (downside scenario)
Pintu News flags a probabilistic base case in which SOL’s $80 support fails, opening a move toward $59–$64 to complete the head-and-shoulders measured target, with the next significant chart level near $41 if $59 breaks. The analysis notes one potential interruption to the bearish path: the Alpenglow upgrade, which targets sub-second transaction finality and was aiming for Q1 2026 mainnet deployment, could shift market narrative toward institutional infrastructure if concrete details emerge (Pintu News, 2 March 2026).
Standard Chartered (institutional research)
Standard Chartered holds a revised end-2026 price target of $250 for SOL, trimmed from a prior estimate of $310, while maintaining a longer-dated roadmap of $400 by end-2027, $700 by end-2028, and $2,000 by 2030. The bank attributes the downward 2026 revision to near-term market repositioning and tighter liquidity conditions, without altering its structural thesis on Solana’s protocol utility (DL News, 2 February 2026).
Predictions and third-party forecasts are inherently uncertain, as they cannot fully account for unexpected market developments. Past performance is not a reliable indicator of future results.
SOL price: Technical overview
The SOL/USD price trades at $90.92 as of 12:52pm UTC on 13 March 2026, sitting just above its short-term moving average cluster: the 20/50/100/200-day SMAs at roughly $85 / $92 / $112 / $151. The 10 and 20-day SMAs both signal buy, while the 50, 100, and 200-day SMAs all sit above price and read sell, reflecting a market where near-term momentum is recovering but the broader trend remains under pressure from higher long-term averages.
The 14-day RSI stands at 55.21, placing it in upper-neutral territory and consistent with a market that has stabilised without yet generating strong directional conviction. The ADX at 22.03 falls short of the 25 threshold that would confirm an established trend, suggesting the current recovery lacks decisive momentum.
To the topside, the classic R1 pivot at $104.81 is the first reference worth watching. A daily close above that level would put R2 near $125.24 in view. The $92–$95 area also merits attention, as the 50-day SMA at $92.34 and the 50-day EMA at $94.62 form a nearby overhead shelf that price would need to clear to extend the short-term advance.
On pullbacks, the classic pivot (P) at $86.14 provides initial support, closely aligned with the 20-day SMA at $85.08 and the volume-weighted moving average at $85.40. Losing that cluster would risk a move toward S1 at $65.71, with the 100-day SMA at $112.14 remaining a distant overhead reference rather than a near-term floor given that price currently trades well below it (TradingView, 12 March 2026).
This is technical analysis for informational purposes only and does not constitute financial advice or a recommendation to buy or sell any instrument.
Solana price history (2024–2026)
SOL/USD’s price opened March 2024 around $165, having already surged through the $100 mark earlier that month as broader crypto sentiment lifted. The token peaked at an intraday high of $295.91 on 19 January 2025 – its two-year peak in the data – before a sharp reversal pulled prices back. SOL closed 2024 at $189.39 and finished 2025 at $124.77, a year-on-year decline of around 34%.
The drawdown continued into 2026. After opening the year near $124.77, SOL slid to an intraday low of $67.64 on 6 February 2026 amid a broad crypto sell-off before recovering. The token has since rebounded toward the $85–$91 range, where it trades as of 13 March 2026.
SOL last traded at $90.92 on 13 March 2026, approximately 27.1% down year to date and 26.5% lower year on year.
Past performance is not a reliable indicator of future results. Share prices are indicative and may differ from live market prices.
Capital.com analyst view: Solana
Solana’s price performance over the past two years reflects a cycle of sharp appreciation and steep correction that has become characteristic of the broader digital asset market. SOL surged to an intraday high near $295.91 in January 2025 as institutional interest grew, memecoin activity on the Solana network drove on-chain volumes to record levels, and crypto-friendly regulatory signals emerged from Washington. The Alpenglow consensus upgrade, targeting sub-second transaction finality, has also attracted attention as a structural development that could broaden the network’s appeal for institutional-grade applications. That said, each of these tailwinds carries a counterpoint: regulatory clarity can reverse quickly, on-chain volumes have since contracted sharply (weekly Solana DEX volumes fell from over $118bn in early February 2026 to around $44.5bn by late February), and protocol upgrades carry execution risk if deployment is delayed or underwhelming.
As of 13 March 2026, SOL trades at $90.92 – around 27% below its January 2026 opening level and more than 69% off the January 2025 peak. Near-term price direction may be shaped by the Federal Reserve’s March policy meeting, macro risk sentiment, and whether the $80 support area continues to hold. Bears point to sustained selling pressure and weakening on-chain activity; bulls argue the current level represents a reset relative to longer-term development milestones. Both scenarios carry genuine uncertainty.
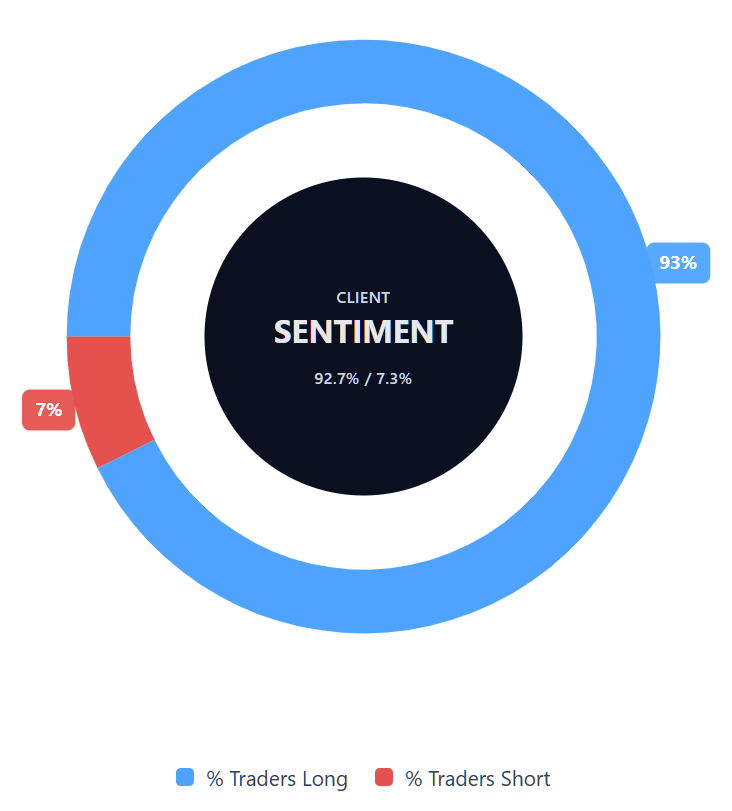
Capital.com’s client sentiment for Solana CFDs
As of 12 March 2026, Capital.com client positioning in Solana CFDs shows buyers at 92.7% versus sellers at 7.3% as of 13 March 2026, which puts buyers ahead by 85.4 percentage points, placing it in heavy-buy, one-sided-towards-longs territory. This snapshot reflects the distribution of open positions on Capital.com at a specific point in time and is subject to change as clients adjust their exposure.
Summary – Solana (2026)
- SOL trades at $90.92 as of 12:52pm UTC on 13 March 2026, down around 27% year to date and 69% below its January 2025 peak near $295.91.
- Short-term moving averages (10–30-day) signal buy, while the 50, 100, and 200-day SMAs all sit above price and read sell; the 14-day RSI is neutral at 55.21.
- Key near-term support sits at the classic pivot of $86.14; a daily close above R1 at $104.81 would be required to open a move toward the $125 area.
- Price drivers include the Federal Reserve’s March policy meeting, delayed rate cut expectations, and a sharp contraction in Solana DEX volumes from $118bn to about $44.5bn per week in February 2026.
- The Alpenglow consensus upgrade, targeting sub-second transaction finality, remains a watched protocol development, though execution risk and deployment timing add uncertainty.
Past performance is not a reliable indicator of future results.
FAQ
What is the latest Solana crypto price prediction?
Who owns the most Solana?
How many Solanas are there?
Could Solana’s price go up or down?
Should I invest in Solana?
Can I trade Solana CFDs on Capital.com?
Yes, you can trade Solana CFDs on Capital.com. Trading crypto CFDs lets you speculate on price movements without owning the underlying asset and to take long or short positions. However, contracts for difference (CFDs) are traded on margin, and leverage amplifies both profits and losses. You should ensure you understand how CFD trading works, assess your risk tolerance, and recognise that losses can occur quickly.