SoFi Technologies stock forecast: Third-party price targets
SoFi Technologies is a Nasdaq-listed US financial technology company providing digital banking, lending and investment services, with its share price influenced by earnings results and broader market conditions. Explore third-party SOFI price targets and technical analysis.
SoFi Technologies, Inc. (SOFI) is trading around $19.67 as of 12:20pm UTC on 16 February 2026, moving within an intraday range of $18.99–$20.64. Past performance is not a reliable indicator of future results.
Recent trading continues as markets digest SoFi’s Q4 2025 earnings. The company reported quarterly revenue of about $1.01bn, exceeding prior consensus estimates and marking its first quarter above the $1bn threshold. It also posted GAAP earnings per share of $0.13 and added roughly 1m members (Yahoo Finance, 30 January 2026). The share price now trades against a backdrop of renewed analyst commentary, including reports that the stock moved lower after earnings despite year-over-year revenue growth of around 39–40% and updated 2026 guidance (Yahoo Finance, 2 February 2026).
SoFi Technologies stock forecast 2026–2030: Third-party price targets
As of 16 February 2026, third-party SoFi Technologies stock predictions show a broad spread of 12-month expectations, with most published objectives clustered in the mid-$20s to low-$30s range. The following summaries outline six recent third-party assessments, focusing on stated targets, time horizons and the principal factors cited.
MarketBeat (consensus snapshot)
MarketBeat reports a consensus one-year SOFI stock forecast of about $25.44, based on coverage from 20 brokers with ratings ranging from Sell to Strong Buy. The report notes that analysts discussed this average target alongside Q4 2025 results and 2026 guidance, while also highlighting valuation considerations, recent pullbacks and high beta as potential risk factors (MarketBeat, 13 February 2026).
Fintel (average price target)
Fintel reports that the average one-year SoFi Technologies price target compiled from Wall Street analysts stood at $27.27 per share, within a range of $12.12 to $39.90 (Nasdaq, 9 February 2026).
J.P. Morgan (investment bank target)
J.P. Morgan upgrades SoFi Technologies to Overweight and sets a 12-month price target of $31, which the publication described as implying around 40% upside from the previous session’s close. The firm states that the bank cited record Q4 revenue of approximately $1.01bn, GAAP EPS of $0.13 and stronger-than-expected 2026 adjusted EBITDA guidance, together with continued member and deposit growth (MarketBeat, 3 February 2026).
Citizens JMP (broker upgrade and target)
Citizens JMP raises its rating on SoFi to Outperform with a stated price target of $30. The publication calculated that this target implied roughly 43.8% upside from the previous close. The report says Citizens JMP pointed to SoFi’s $0.13 EPS and approximately $1.01bn in quarterly revenue – its first quarter above $1bn – and referenced 2026 guidance for around 30% revenue growth and about 52% adjusted EBITDA growth as inputs into its valuation framework (MarketBeat, 9 February 2026).
Predictions and third-party forecasts are inherently uncertain, as they cannot fully account for unexpected market developments. Past performance is not a reliable indicator of future results.
SOFI stock price: Technical overview
The SOFI stock price is trading around $19.67 as of 12:20pm UTC on 16 February 2026, sitting below its key simple moving average cluster. The 20-, 50-, 100- and 200-day moving averages stand near $23, $25, $27 and $23 respectively. The short-term Hull moving average, around $19.9, also sits above the current price. Meanwhile, the 14-day relative strength index (RSI) reads near 29.8, placing it in oversold territory, and the average directional index (ADX) around 31.7 suggests an established trend. Taken together, these indicators show price trading at the lower end of its recent technical range rather than consolidating around its longer-term averages.
On the topside, the nearest classic pivot resistance sits around $27.68, with $32.54 marking the next reference area if the price closes above the first level on a sustained basis. On pullbacks, the classic pivot near $24.99 represents initial support within this framework. The 100-day simple moving average, around $26.83, may act as a dynamic resistance area, while the S1 level near $20.13 identifies a lower support zone if selling pressure continues (TradingView, 16 February 2026).
Technical analysis reflects historical price data and indicator readings. It does not guarantee future performance and should not be considered financial advice.
SoFi Technologies share price history (2024–2026)
Over the past two years, SOFI’s stock price has moved from around $8.51 at the close on 20 February 2024 to $19.67 on 13 February 2026. During early 2024, the stock traded largely below $10 before building upward momentum from April 2025. It then broke above $10 and advanced into the mid-teens and low-$20s by mid-year.
The trend extended into late 2025 and early 2026. SOFI rose from the high-$20s and low-$30s range in November to finish 2025 at $26.16. It subsequently touched intraday highs above $29.90 in early January before retracing towards the high-teens by mid-February 2026. This sequence highlights periods of both acceleration and correction within the broader two-year recovery.
Past performance is not a reliable indicator of future results. Share prices are indicative and may differ from live market prices.
SoFi Technologies (SOFI): Capital.com analyst view
SoFi Technologies’ share price has recovered from single-digit levels in early 2024 to trade in the high-teens by mid-February 2026. Market participants have responded to the company’s efforts to scale operations and move towards sustained profitability. At the same time, the pullback from January highs above $29.90 illustrates how sentiment around higher-growth financial technology stocks can shift as earnings expectations and macroeconomic conditions evolve.
One interpretation is that continued growth in members and revenues may support longer-term interest in the stock. An alternative view is that pronounced rallies followed by sharp retracements underline sensitivity to earnings releases, interest-rate expectations and broader risk appetite.
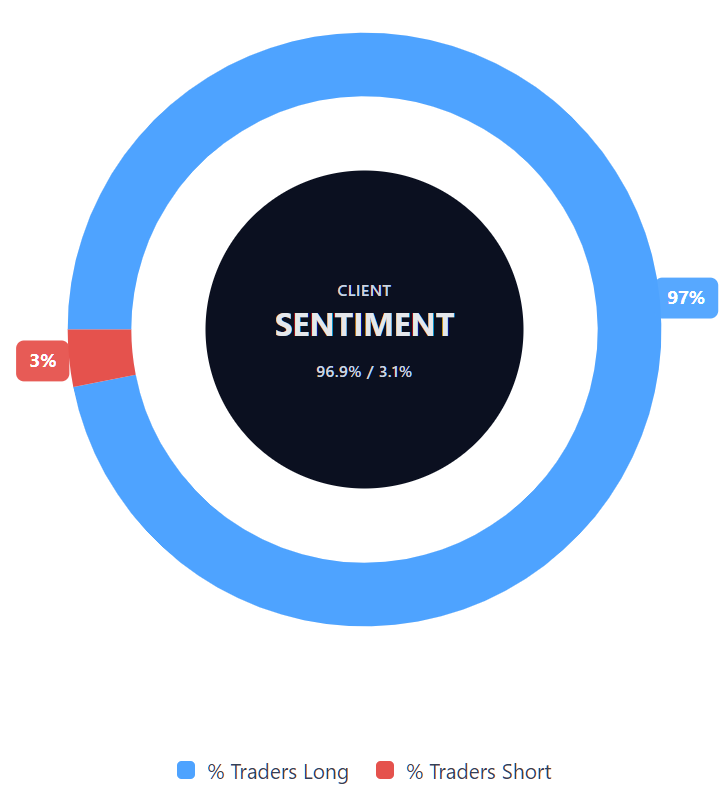
Capital.com’s client sentiment for SoFi Technologies CFDs
As of 16 February 2026, Capital.com client positioning in SoFi Technologies CFDs currently shows 96.9% buyers compared with 3.1% sellers, placing buyers ahead by approximately 93.8 percentage points. This indicates a strong skew towards long positions rather than a balanced distribution.
This data reflects open CFD positions on the Capital.com platform at the time of writing and may change as market conditions evolve.
Summary – SoFi Technologies 2026
- SoFi Technologies’ share price has risen from around $8.51 in February 2024 to $19.67 by 13 February 2026, following an extended period below $10 through early 2024.
- Technical indicators currently show price trading below its 20-, 50-, 100- and 200-day moving averages, with the 14-day RSI near oversold territory and the ADX signalling an established trend.
- The stock remains sensitive to earnings releases, forward guidance, interest-rate expectations and shifts in broader risk appetite. As with all equity-linked CFDs, price movements can be significant in either direction, and traders should consider both potential gains and losses when assessing exposure.
Past performance is not a reliable indicator of future results.
FAQ
Who owns the most SoFi Technologies stock?
Public filings show that SoFi Technologies’ largest shareholders typically include institutional investors such as asset managers, mutual funds and exchange-traded funds. Company executives and directors may also hold shares through compensation or long-term incentive plans. Ownership levels can shift over time as institutions rebalance portfolios or insiders adjust their holdings. Investors can consult recent regulatory filings, such as those submitted to the US Securities and Exchange Commission (SEC), for updated information on major shareholders.
What is the five-year SoFi Technologies share price forecast?
There is no single agreed five-year SOFI stock forecast. Most published analyst price targets focus on a 12-month horizon rather than longer-term projections. Longer-term expectations depend on factors such as revenue growth, profitability, interest-rate trends and broader market conditions. Because these projections rely on assumptions that may evolve, they represent forward-looking scenarios rather than fixed outcomes. As with all equity forecasts, actual performance may differ from published estimates.
Is SoFi Technologies a good stock to buy?
Whether SoFi Technologies is considered a suitable investment depends on an individual’s objectives, risk tolerance and time horizon. The company has reported revenue growth and expanding membership, while its share price has also experienced periods of volatility. Market sentiment, earnings updates and macroeconomic conditions may influence performance. Investors typically weigh potential returns against the possibility of capital loss before making a decision. This information is provided for general purposes only and does not constitute investment advice.
Could SoFi Technologies stock go up or down?
SoFi Technologies’ share price can move in either direction. Company-specific developments, earnings results, changes in guidance and shifts in interest-rate expectations may all influence price action. Broader market conditions and investor sentiment towards financial technology stocks can also affect valuation. As with many growth-oriented companies, price fluctuations can be pronounced, which may increase both potential opportunity and potential risk.
Should I invest in SoFi Technologies stock?
Deciding whether to invest in SoFi Technologies requires careful consideration of personal financial circumstances, investment goals and risk appetite. Shares provide exposure to the company’s business performance but remain subject to market risk. Capital values can rise or fall, and investors may receive back less than their initial outlay. Some traders choose to access price movements through CFDs, which allow speculation on rising or falling prices without owning the underlying shares, but these instruments involve leverage and higher risk.
Can I trade SoFi Technologies CFDs on Capital.com?
Yes, you can trade SoFi Technologies CFDs on Capital.com. Trading share CFDs lets you speculate on price movements without owning the underlying asset and to take long or short positions. However, contracts for difference (CFDs) are traded on margin, and leverage amplifies both profits and losses. You should ensure you understand how CFD trading works, assess your risk tolerance, and recognise that losses can occur quickly.