Siemens stock forecast: Targets adjusted after 2025 guidance
Siemens AG is a German industrial technology group listed on the Frankfurt Stock Exchange, with operations spanning automation, infrastructure, mobility and healthcare technology through Siemens Healthineers. Explore third-party SIE price targets and technical analysis.
Siemens AG (SIE) is trading around €241.75 in early European dealings on 19 February 2026, moving within an intraday range of €240.25–€246.85 on Capital.com’s feed as of 11:30am UTC. Past performance is not a reliable indicator of future results. The broader backdrop remains mixed, particularly in Europe, where Germany has reported subdued manufacturing output (Bloomberg, 6 February 2026).
Siemens stock forecast 2026–2030: Third-party price targets
As of 19 February 2026, third-party Siemens stock predictions show a spread of 12-month estimates ranging from €185 to €325. These projections reflect differing assumptions around order growth, AI-related demand and margin sustainability following the group’s upgraded 2026 outlook. Analyst targets are subjective assessments rather than guarantees and may change as new earnings data and macroeconomic information emerge.
Reuters consensus (news-based snapshot)
Reuters reports that analysts covering Siemens lifted earnings expectations and price targets after the company exceeded first-quarter forecasts and raised its full-year 2026 profit guidance. According to the report, revisions reflect stronger-than-expected performance in automation and industrial software, alongside references to AI and data-centre demand and management’s upgraded outlook (Reuters, 12 February 2026).
Goldman Sachs (broker research)
Goldman Sachs reiterates a bullish stance on Siemens, setting a price target of €264, above the prevailing spot price at the time. The firm attributes this view to higher-than-expected automation profitability and the raised guidance, alongside expectations of continued capital expenditure linked to AI and data centres (The Globe and Mail, 13 February 2026).
J.P. Morgan (broker research)
J.P. Morgan analyst Phil Buller lifts his SIE stock forecast to €325 from €300, while reiterating an Overweight rating following the latest results. The firm cites order momentum, exposure to AI-related spending and improved confidence in medium-term revenue growth as factors underpinning the revised 12-month objective (TipRanks, 13 February 2026).
RBC Capital Markets (broker research)
RBC Capital Markets raised its Siemens price target of €185 after the fiscal first-quarter earnings beat and guidance upgrade. The note referenced improved automation margins and continued order strength as inputs in its updated valuation framework (MarketScreener, 16 February 2026).
Predictions and third-party forecasts are inherently uncertain, as they cannot fully account for unexpected market developments. Past performance is not a reliable indicator of future results.
SIE stock price: Technical overview
On the daily chart, the SIE stock price trades near €241.75 as of 11:30am UTC on 19 February 2026, below its main simple moving average cluster, with the 20-, 50-, 100- and 200-day SMAs around €251, €248, €242 and €233 respectively. The 20-day SMA remains slightly above the 50-day SMA, and both sit above the current spot price. The 14-day RSI, at approximately 43.9, sits in lower-neutral territory, while the ADX near 18.6 points to a relatively modest trend environment. The 200-day SMA and EMA converge around €233, forming a longer-term reference zone. The Hull moving average, near €235.8, tracks slightly above the current price.
On the topside, traders often monitor the classic R1 pivot near €267.2, with R2 around €278.1, should price close decisively above the initial resistance area. On pullbacks, the classic pivot near €252.2 acts as a reference level above spot, while the 100-day SMA around €242 forms a nearby medium-term technical area. A sustained move below that region could expose the S1 level near €241.3 and potentially open the way towards the €226–€233 zone defined by S2 and the 200-day averages (TradingView, 19 February 2026).
This technical analysis is provided for informational purposes only and does not constitute financial advice or a recommendation to buy or sell any instrument.
Siemens share price history (2024–2026)
Over the past two years, SIE’s stock price has risen from around €169.60 at the close on 21 February 2024 to approximately €242.30 on 19 February 2026. The move unfolded in stages. During 2024, the stock advanced from the mid-€160s into the high-€180s. In early 2025, price moved from roughly €188.95 on 2 January to above €220 by late February.
The trend included interim pullbacks, including a move towards €180 in April 2025 and a decline into the low-€230s in December 2025. In January 2026, Siemens traded in the mid-€250s before easing back towards the low-€240s into mid-February. Past performance is not a reliable indicator of future results.
Past performance is not a reliable indicator of future results. Share prices are indicative and may differ from live market prices.
Siemens (SIE): Capital.com analyst view
Siemens’ share price has recovered over the past two years, moving from the high-€160s in early 2024 to the low-€240s by 19 February 2026. Recent reported results included a strong start to fiscal 2026, with 10% comparable order growth to €21.4bn in Q1 and an 8% increase in comparable revenue, alongside raised guidance for earnings per share and revenue growth.
At the same time, price has shown sensitivity to earnings releases and guidance updates, highlighting how quickly market expectations can adjust. Commentary has focused on industrial AI and data-centre demand as potential growth drivers, with management outlining a fiscal 2026 EPS pre-PPA range of €10.70–€11.10.
However, Germany’s manufacturing backdrop remains soft, with the HCOB German manufacturing PMI at 47.0 in December 2025. Macroeconomic headwinds, export trends and cyclical factors could influence future performance if conditions shift or guidance changes. Siemens’ future share price path will depend on how these supportive themes and risks evolve over time. This commentary is for informational purposes only and does not constitute investment advice.
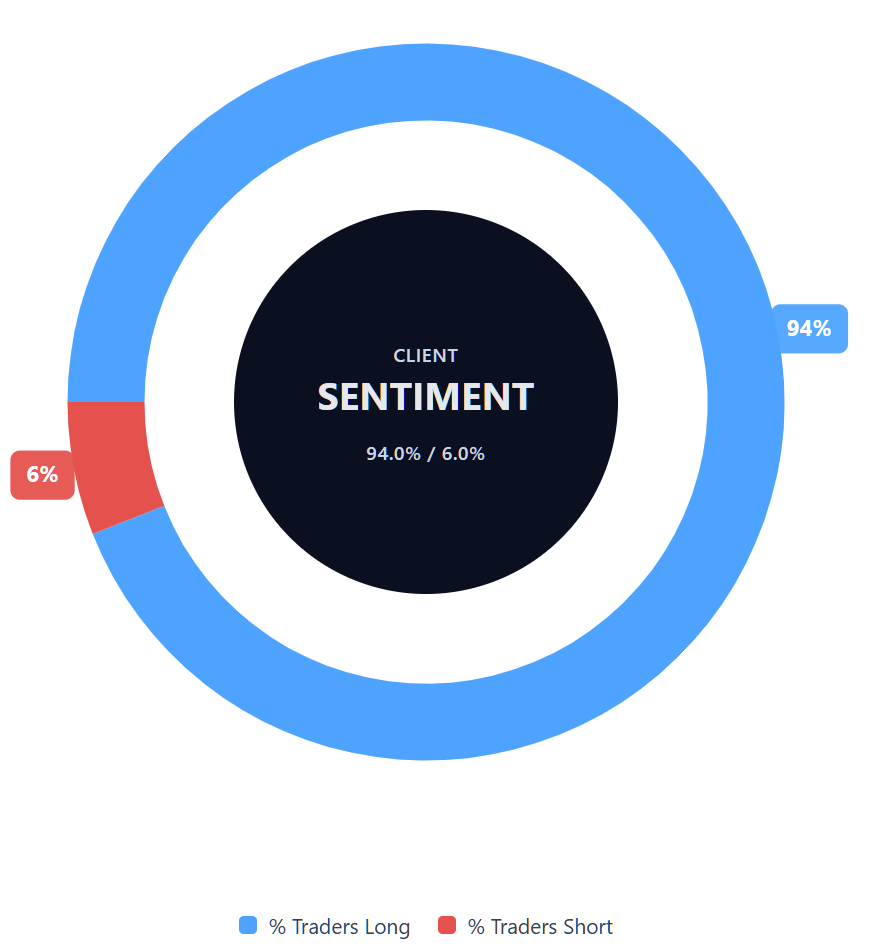
Capital.com’s client sentiment for Siemens CFDs
As of 19 February 2026, Capital.com client positioning in Siemens CFDs remains weighted towards long positions, with 94% buyers and 6% sellers – a difference of approximately 88 percentage points. This distribution reflects open positions held by Capital.com clients at the time of writing and may change. It does not represent a broader market consensus or a trading recommendation.
Summary – Siemens 2026
- Siemens’ share price has moved from around €169 in early 2024 to the low-€240s by 19 February 2026, with several interim pullbacks.
- Technical indicators place price below the 20-, 50- and 100-day moving averages, while the 200-day average near €233 serves as a longer-term reference area and the 14-day RSI remains in neutral territory.
- In early 2026, reported drivers include upgraded guidance, order growth in industrial divisions and references to AI-related demand, alongside a softer German manufacturing backdrop. News coverage has centred on first-quarter results and revised outlooks, prompting updates to several analyst price targets.
Past performance is not a reliable indicator of future results.
FAQ
Who owns the most Siemens stock?
Siemens AG has a broad shareholder base that includes institutional investors, asset managers and retail shareholders. Large global investment firms often rank among the largest shareholders through index and actively managed funds, while no single shareholder holds an outright controlling stake. Ownership levels can change over time due to portfolio rebalancing, corporate actions and market transactions. For the most current breakdown, refer to recent regulatory filings and official company disclosures.
What is the 5-year Siemens share price forecast?
There is no fixed five-year SIE stock forecast. Most published analyst targets focus on 12-month horizons and reflect specific assumptions about earnings, order growth and macroeconomic conditions at the time of publication. Longer-term projections depend on factors such as industrial demand, capital expenditure trends, margins and broader economic cycles. Forecasts are estimates rather than guarantees and may change as new data emerges or conditions evolve.
Is Siemens a good stock to buy?
Whether Siemens is considered a ‘good’ stock depends on an individual’s objectives, risk tolerance and time horizon. Recent commentary has highlighted upgraded guidance and order trends, while also noting exposure to cyclical industrial demand and macroeconomic uncertainty. Share prices can react to earnings releases, guidance revisions and wider market developments. Investors typically review fundamentals, valuation metrics, competitive positioning and risk factors before making any investment decision. This information is for educational purposes only and does not constitute investment advice.
Could Siemens stock go up or down?
Like any listed equity, Siemens’ share price can move up or down in response to company results, changes in guidance, analyst revisions and broader economic developments. Technical indicators, such as moving averages and RSI levels, may provide context on recent price behaviour but do not predict future performance. Macroeconomic data, including manufacturing activity in key regions, can also influence expectations and price direction. Past performance is not a reliable indicator of future results.
Should I invest in Siemens stock?
Deciding whether to invest in Siemens shares is a personal decision that should reflect your financial situation, investment goals and appetite for risk. Shares provide exposure to industrial and technology-related trends, but they also carry market and company-specific risks. If you are uncertain, consider seeking independent financial advice before investing. This content is provided for informational and educational purposes only and does not constitute investment advice.
Can I trade Siemens CFDs on Capital.com?
Yes, you can trade Siemens CFDs on Capital.com. Trading share CFDs lets you speculate on price movements without owning the underlying asset and to take long or short positions. However, contracts for difference (CFDs) are traded on margin, and leverage amplifies both profits and losses. You should ensure you understand how CFD trading works, assess your risk tolerance, and recognise that losses can occur quickly.