Siemens Energy stock forecast: Record orders, buyback support
Siemens Energy is a German energy technology company whose recent results included €17.6 billion in new orders, €746 million in net profit and a €2 billion share buyback programme. Past performance is not a reliable indicator of future results. Explore third-party ENR price targets and technicals.
Siemens Energy AG (ENR) is trading at €151.11 as of 4:36pm UTC on 24 March 2026, with an intraday range of €134.86–€152.45. Past performance is not a reliable indicator of future results.
The recovery appears driven by several converging factors. A retreat in oil prices eased input-cost concerns and reduced the recent risk premium across capital goods and grid infrastructure names, with dip-buying and short covering cited as key contributors to ENR's rebound from its lows (). Session turnover also reportedly exceeded typical trading volumes, according to Meyka. The move also aligns with broader DAX strength, as declining geopolitical risk sentiment lifted the German benchmark and supported industrials – including Siemens Energy (Meyka, 24 March 2026).
Siemens Energy reported Q1 fiscal 2026 net profit of €746 million, up nearly threefold year on year, record new orders of €17.6 billion (+34%), and a €2 billion share buyback programme (Reuters, 11 February 2026). Additionally, ENR's recent inclusion in three major indices triggered mandatory passive-fund purchases, adding a structural demand layer to the stock (Ad Hoc News, 21 March 2026).
Siemens Energy stock forecast 2026–2030: Third-party price targets
As of 24 March 2026, third-party Siemens Energy stock predictions reflect broadly constructive sentiment, anchored by record order intake, AI-driven power infrastructure demand, and an improving free cash flow outlook. The following targets summarise external analyst estimates and consensus data.
Simply Wall St (DCF-based valuation)
Simply Wall St reports a consensus analyst price target of approximately €83.76 for ENR, derived from broker models anchored to expected earnings growth and profitability rather than recent price momentum. The platform notes that this target sits materially below prevailing market levels, citing the stock's stretched valuation relative to near-term earnings estimates as a key contextual factor (Simply Wall St, 11 March 2026).
BofA Global Research (gas aftermarket upgrade)
BofA Global Research raised its ENR stock forecast to €220 from €200, citing what it describes as substantially underestimated gas aftermarket growth potential as the primary driver of the revision. The bank maintains a buy rating, with its revised target reflecting increased confidence in the durability and scale of ENR's gas services revenue stream (MarketScreener, 9 March 2026).
MarketScreener (broker consensus snapshot)
MarketScreener reports that 25 analysts covering ENR carry a mean consensus rating of buy and an average 12-month price target of €165.68, with estimates ranging from a low of €89 to a high of €220. The spread reflects divergent assumptions around Siemens Gamesa profitability, gas turbine cycle duration, and free cash flow conversion, with the last recorded close at €157.70 at the time of capture (MarketScreener, 10 March 2026).
Investing.com (consensus estimate aggregation)
Investing.com aggregates 25 analyst submissions and places the average 12-month ENR price target at €165.68, with the high estimate reaching €220. The aggregation reflects models built around sustained demand for grid modernisation and gas turbine servicing, with earnings and revenue estimate revisions skewed upward following the company's fiscal first-quarter results (Investing.com, 24 March 2026).
Predictions and third-party forecasts are inherently uncertain, as they cannot fully account for unexpected market developments. Past performance is not a reliable indicator of future results.
ENR stock price: Technical overview
The ENR stock price trades at €151.11 as of 4:36pm UTC on 24 March 2026, sitting in a mixed zone where short-term moving averages signal opposing pressures. The 10-day simple moving average (SMA) at approximately €148 and the 50-day SMA at approximately €151 both register buy signals on TradingView, while the 20-day SMA at approximately €154 and the 30-day SMA at approximately €157 sit above price and register sell signals. Meanwhile, the 100-day and 200-day SMAs at approximately €133 and approximately €114 respectively remain well below current levels and carry buy signals, suggesting that the longer-term trend backdrop remains constructive even as near-term averages show conflicting pressure. The Hull moving average (9) at approximately €145 registers a buy signal, while the Ichimoku base line at approximately €153 sits fractionally above price and reads neutral.
Momentum indicators are broadly mixed. The 14-day relative strength index (RSI) registers 48.85, a neutral mid-range reading that implies neither overbought nor oversold conditions at this stage. The MACD (12, 26) level at -1.92 and momentum (10) at -7.40 both carry sell signals on TradingView, while the average directional index (ADX) at 22.60 falls below the 25 threshold, indicating that there is no clearly established directional trend at present.
On the upside, the classic R1 pivot at €179.38 represents the nearest reference above current price; a daily close through that level would put the R2 area near €192 in view. The classic pivot point (P) at €158.72 sits just above current price and may act as an initial reference on any near-term advance.
On the downside, the S1 classic pivot at €145.78 is the first nearby reference below the last price, followed by the 100-day SMA shelf at approximately €133. A sustained move below that shelf would open the path towards the S2 area near €125, with the 200-day SMA at approximately €114 representing a longer-term reference below (TradingView, 24 March 2026).
This is technical analysis for informational purposes only and does not constitute financial advice or a recommendation to buy or sell any instrument.
Siemens Energy share price history (2024–2026)
ENR’s stock price rose from around €16.55 in late March 2024 to €151.11 at the time of writing on 24 March 2026 – a gain of roughly 813% over that period.
The stock closed out 2024 at €50.255, having gained more than 200% from its late-March 2024 level, as improving sentiment around the company's restructuring and a turnaround at its Siemens Gamesa wind unit began to draw investors back in. However, ENR hit a turbulent patch in early April 2025, closing as low as €48.56 on 7 April 2025 amid broader market volatility, briefly erasing most of those gains. The recovery from that trough was sharp; ENR ended 2025 at €120.625 – up approximately 138% from its 2 January 2025 open of €50.695.
Momentum carried into 2026, with ENR reaching a recent closing high of €166.67 on 27 February 2026 before pulling back through March. ENR closed at €151.11 on 24 March 2026, approximately 22.8% up year to date and around 148.6% up year on year.
Past performance is not a reliable indicator of future results. Share prices are indicative and may differ from live market prices.
Siemens Energy (ENR): Capital.com analyst view
Siemens Energy's price performance over the past two years reflects a significant re-rating, driven by a structural shift in market perception from a troubled conglomerate managing wind turbine losses to a beneficiary of AI-driven power infrastructure demand and grid modernisation. Record order intake, a near-tripling of net profit in fiscal Q1 2026, and a €2 billion share buyback programme have reinforced that narrative, supporting the stock's move from the mid-€50s at the start of 2025 to closing highs above €166 in late February 2026. That said, the April 2025 sell-off to around €48 and the subsequent March 2026 pullback from those highs illustrate that the stock remains sensitive to broader market sentiment shifts, trade policy uncertainty, and any signs of slowing order momentum.
The ongoing energy transition and data centre build-out present a potentially supportive demand backdrop for Siemens Energy's gas turbine and grid businesses. However, execution risk at Siemens Gamesa, margin pressure from supply chain costs, and the stretched valuation implied by some analyst models could weigh on the stock if earnings delivery falls short of elevated expectations.
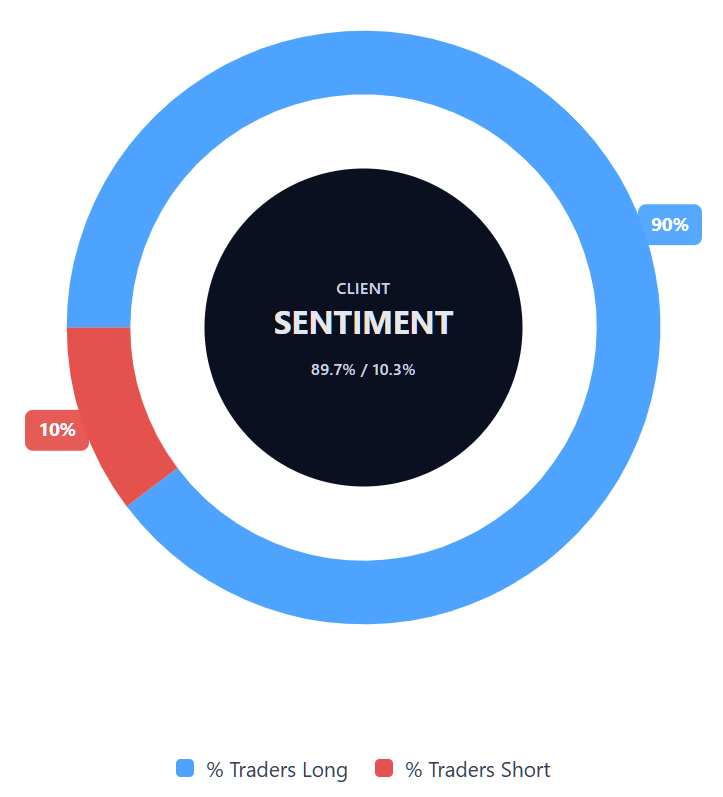
Capital.com’s client sentiment for Siemens Energy CFDs
As of 24 March 2026, Capital.com client positioning in Siemens Energy CFDs shows 89.7% buyers and 10.3% sellers, putting buyers ahead by 79.4 percentage points and placing sentiment firmly in a heavy-buy, one-sided-long territory. This snapshot reflects open positions on Capital.com and can change rapidly as market conditions evolve.
Summary – Siemens Energy 2026
- ENR trades at €151.11 as of 4:36pm UTC on 24 March 2026, up approximately 22.8% year to date and 148.6% year on year.
- Technical indicators are mixed: the 14-day RSI sits at 48.85 (neutral), MACD is negative, and short-term SMAs conflict, with the 20-day and 30-day SMAs above price while the 10-day SMA sits below.
- The ADX at 22.60 indicates no clearly established directional trend, with the classic pivot point at €158.72 acting as an upside reference and the nearest downside reference at S1 €145.78.
- Key price drivers include AI-driven data centre demand for gas turbines and grid infrastructure, a €2 billion share buyback, and fiscal Q1 2026 net profit nearly tripling year on year.
Past performance is not a reliable indicator of future results.
FAQ
Who owns the most Siemens Energy stock?
What is the 5 year Siemens Energy share price forecast?
Is Siemens Energy a good stock to buy?
Could Siemens Energy stock go up or down?
Yes. As the article notes, Siemens Energy can move in either direction because its share price responds to company results, order momentum, sector developments, market sentiment and wider macro conditions. Recent trading has also shown meaningful volatility, including sharp rebounds and pullbacks within relatively short periods. Technical indicators in the article were mixed rather than directional, which suggests traders may watch both upside and downside reference levels instead of assuming a clear near-term trend.
Should I invest in Siemens Energy stock?
Can I trade Siemens Energy CFDs on Capital.com?
Yes, you can trade Siemens Energy CFDs on Capital.com. Trading share CFDs lets you speculate on price movements without owning the underlying asset and to take long or short positions. However, contracts for difference (CFDs) are traded on margin, and leverage amplifies both profits and losses. You should ensure you understand how CFD trading works, assess your risk tolerance, and recognise that losses can occur quickly.