SAP stock forecast: Third-party price targets
SAP SE is a Germany-based multinational software company listed on the Frankfurt Stock Exchange and NYSE, specialising in enterprise resource planning (ERP) and cloud-based business applications. Explore third-party SAP price targets and technical analysis.
SAP SE (SAP) is trading around €170.15 as of 10:31am (UTC) on 20 February 2026, within an intraday range of approximately €169.75–€173.90 on the Capital.com platform. Past performance is not a reliable indicator of future results.
The stock is moving amid continued follow-through from SAP’s recent Q4 and full-year 2025 results. The company reported total revenue growth of about 8–11% at constant currencies and a double-digit increase in non-IFRS operating profit, alongside strong cloud revenue and backlog metrics (SAP, 29 January 2026). Trading activity also reflects the announcement on 18 February 2026 that SAP’s Executive and Supervisory Boards are proposing a dividend of €2.50 per share for 2025, a 6.4% increase on the prior year (SAP, 19 February 2026). The proposal remains subject to shareholder approval at the annual general meeting.
SAP stock forecast 2026–2030: Third-party price targets
As of 20 February 2026, third-party SAP stock predictions show a broad range across euro- and dollar-denominated listings, as brokers and data providers update their models following the company’s Q4 2025 results and the subsequent share-price decline. The sections below summarise several recent one-year targets and consensus markers, focusing on publications from late January and February 2026.
Yahoo Finance (consensus revision)
Yahoo Finance reports that the average 12-month price target for SAP SE has been reduced by 6.7% to around €258 per share, with individual analyst targets ranging from approximately €187 to €320. According to the report, analysts lowered revenue forecasts as they reassessed SAP’s growth profile following recent results and market volatility, although headline earnings projections remained broadly unchanged (Yahoo Finance, 1 February 2026).
Fintel (broker consensus)
Nasdaq notes that the average SAP stock forecast stands at around €255.34 per share. Current targets range from around €150.12 to approximately €332.93 per share, reflecting adjustments to valuation assumptions and risk premia after the recent drawdown and revised expectations for cloud-related growth (Nasdaq, 4 February 2026).
MarketBeat (NYSE listing, average target)
MarketBeat reports that SAP SE holds a ‘Moderate Buy’ consensus rating from 19 analysts, with an average 12-month price target of approximately $322. The publication states that this figure incorporates recent research updates from major brokers and reflects expectations for continued cloud development and margin performance, alongside broader software-sector conditions (MarketBeat, 2 February 2026).
TD Cowen (broker update)
TD Cowen lowers its target for the NYSE-listed shares to $300 from $330 while reiterating a Buy rating. The broker attributes the reduction primarily to mechanical valuation factors and weaker-than-anticipated cloud current backlog relative to earlier guidance, while maintaining its medium-term cloud growth assumptions (Investing.com, 30 January 2026).
Predictions and third-party forecasts are inherently uncertain, as they cannot fully account for unexpected market developments. Past performance is not a reliable indicator of future results.
SAP stock price: Technical overview
The SAP stock price is trading around €170.15 as of 10:31am (UTC) on 20 February 2026, holding below its short- and medium-term moving-average cluster. The 20-, 50-, 100- and 200-day SMAs sit near 175, 193, 208 and 228 respectively. The 14-day RSI stands around 40, indicating lower-neutral momentum, while the ADX near 24 suggests that trend strength remains modest rather than firmly established.
On the topside, traders may monitor the classic R1 pivot near 205.9, with R2 around 241.3 only becoming relevant if price records a sustained move above the first resistance level. On pullbacks, the classic pivot near 184.0 serves as a nearby reference level, while the 100-day SMA around 207.9 marks a further moving-average threshold. A break below the S1 level near 148.7 could expose the lower S2 area around 126.8 (TradingView, 20 February 2026).
This technical analysis is provided for informational purposes only and does not constitute financial advice or a recommendation to buy or sell any instrument.
SAP share price history (2024–2026)
Over the past two years, SAP’s stock price has shifted from trading above €250 in early 2025 to levels closer to €170 by February 2026. The share closed at €275.65 on 20 February 2025 and spent much of March–July 2025 fluctuating between approximately €245 and €270, with several moves towards the €270–€280 area before momentum eased into the autumn.
From late 2025, the stock entered a gradual downtrend, moving from around €230–€240 in November–December to just above €200 by early January 2026, before a sharper decline followed. After closing at €213.35 on 13 January 2026 and reaching an intraday high near €219.70, the share reversed lower and accelerated to the downside. Prices fell from roughly €196–€202 in late January to €170.55 on 20 February 2026, leaving the stock down by around one third compared with levels seen a year earlier.
Past performance is not a reliable indicator of future results. Share prices are indicative and may differ from live market prices.
SAP (SAP): Capital.com analyst view
SAP’s share price has faced pressure in early 2026, declining from levels above €200 in January towards the €170 area by 20 February 2026 as markets responded to the latest earnings and guidance updates. The Q4 and full-year 2025 results showed structural developments, including a 22% increase in total cloud backlog to approximately €77.3bn and cloud revenue growth of more than 20% year on year. Some market participants view these figures as supportive of SAP’s longer-term transition towards cloud and AI-enabled ERP services.
At the same time, the shortfall relative to earlier ambitions for current cloud backlog growth, combined with the scale of the subsequent share-price decline, illustrates how valuation-sensitive software stocks can react when key metrics diverge from expectations. Even where headline revenues and profits continue to expand, shifts in guidance, execution risks, macroeconomic uncertainty and changing risk appetite can influence volatility and pricing.
Recent capital return proposals add another dimension to the debate. SAP has proposed a dividend of €2.50 per share for 2025, up 6.4% year on year, and signalled an intention to distribute at least 40% of non-IFRS profit after tax over time. While some observers view rising dividends and free cash flow targets as supportive factors, others note that delivery against cloud growth objectives and broader macro conditions may continue to shape market expectations.
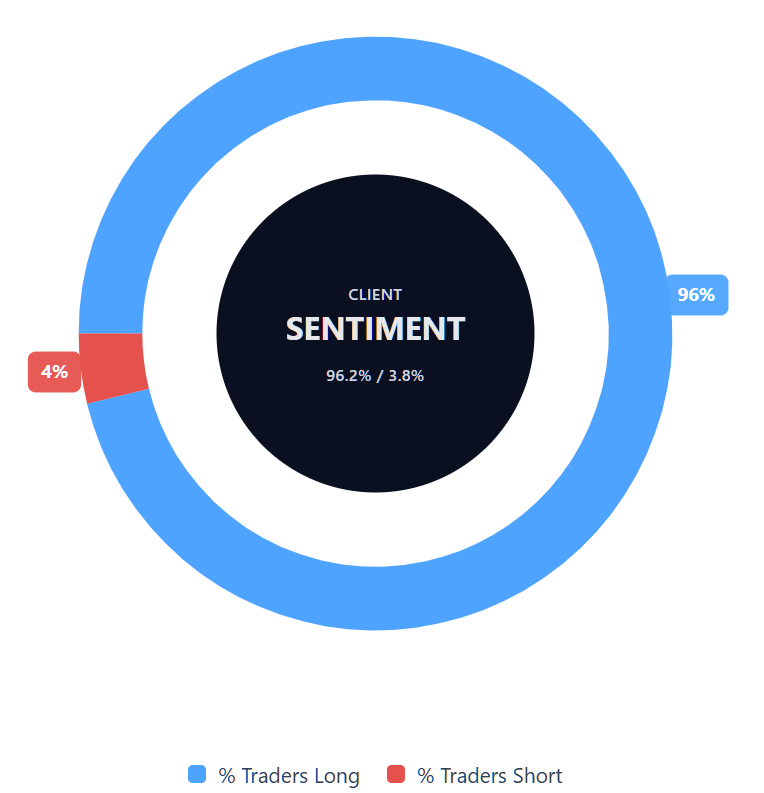
Capital.com’s client sentiment for SAP CFDs
As of 20 February 2026, Capital.com client positioning in SAP CFDs remains heavily skewed towards long positions, with 96.2% buyers compared with 3.8% sellers. This represents a difference of approximately 92 percentage points. This data reflects open positions on the Capital.com platform at the time of writing and may change.
Summary – SAP 2026
- As of 10:31am (UTC) on 20 February 2026, SAP traded near €170.15, below its early 2025 range around €270–€280.
- Technical indicators show the price trading beneath its 20-, 50-, 100- and 200-day SMAs, while a 14-day RSI around 40 indicates lower-neutral momentum and ADX readings point to modest trend strength.
- Recent price drivers include SAP’s Q4 and full-year 2025 results, which combined double-digit cloud growth and an expanding cloud backlog with market concerns regarding backlog momentum and guidance relative to prior expectations.
- The proposed €2.50 dividend for 2025 represents a 6.4% year-on-year increase. While some market participants view capital returns as a sign of financial discipline, others continue to monitor execution, cloud growth trends and broader macro risks.
Past performance is not a reliable indicator of future results.
FAQ
Who owns the most SAP stock?
SAP SE is a publicly listed company, and its shares are held by a mix of institutional investors, asset managers and private shareholders. Large global investment firms and index funds typically account for a significant proportion of total holdings, alongside strategic long-term investors. Ownership levels can change over time due to portfolio rebalancing, fund flows and corporate activity, so the identity of the largest shareholder may differ according to the most recent regulatory filings.
What is the 5 year SAP share price forecast?
There is no fixed or guaranteed five-year SAP stock forecast. Analyst targets generally focus on 12-month projections and can differ widely depending on assumptions about cloud growth, margins, macroeconomic conditions and sector valuations. Longer-term forecasts carry a high degree of uncertainty, as they depend on execution, competitive dynamics and broader market sentiment. Investors typically treat extended projections as indicative scenarios rather than precise expectations.
Is SAP a good stock to buy?
Whether SAP is considered a ‘good’ stock depends on individual objectives, risk tolerance and time horizon. Some market participants focus on its transition towards cloud-based software and recurring revenue, while others evaluate valuation metrics, growth rates and competitive pressures. Share prices reflect both company-specific developments and wider technology-sector trends. This information is provided for general purposes only and does not constitute investment advice.
Could SAP stock go up or down?
SAP’s share price can move in either direction, depending on earnings results, guidance updates, macroeconomic data and broader equity-market conditions. Changes in cloud backlog growth, profitability trends or sector sentiment may influence volatility. Like other technology stocks, SAP can react sharply when expectations shift. Past performance does not guarantee future returns, and price movements may be significant over short periods.
Should I invest in SAP stock?
Deciding whether to invest in SAP shares is a personal decision that should reflect your financial situation, objectives and appetite for risk. Equity investments can rise or fall in value, and both company-specific and market-wide developments may affect performance. Reviewing financial statements, analyst commentary and risk disclosures may help inform your assessment. If you are uncertain, you may wish to seek independent financial advice before making an investment decision.
Can I trade SAP CFDs on Capital.com?
Yes, you can trade SAP CFDs on Capital.com. Trading share CFDs lets you speculate on price movements without owning the underlying asset and to take long or short positions. However, contracts for difference (CFDs) are traded on margin, and leverage amplifies both profits and losses. You should ensure you understand how CFD trading works, assess your risk tolerance, and recognise that losses can occur quickly.