Plug Power stock forecast: Third-party price targets
Plug Power is a US hydrogen fuel cell and electrolyser manufacturer listed on Nasdaq, operating across clean energy infrastructure, hydrogen production and related technology solutions. Explore third-party PLUG price targets and technical analysis.
Plug Power, Inc. (PLUG) is trading around €1.89 in early European hours on 19 February 2026, moving at the top of its intraday range between €1.79 and €1.89, as quoted on the Capital.com platform at 11:46am UTC. Past performance is not a reliable indicator of future results.
Recent trading is taking place amid ongoing governance and financing developments, including a series of special shareholder meetings where Plug Power has sought approval for charter amendments to increase authorised common shares (Investing.com, 30 January 2026). The backdrop also includes class action securities lawsuits filed in February 2026 alleging misleading disclosures linked to a previously announced US Department of Energy loan guarantee and related hydrogen projects (Bloomberg Law, 3 February 2026), alongside operational updates such as the completion of 100 MW of PEM electrolyser capacity at Galp’s Sines refinery in Portugal (Investing.com, 23 January 2026).
Plug Power stock forecast 2026–2030: Third-party price targets
As of 19 February 2026, third-party Plug Power stock predictions show a wide range of 12-month expectations, highlighting differing assumptions around funding, execution and hydrogen market prospects. The summaries below outline recent third-party targets and assumptions reported during February 2026.
MarketBeat (broker consensus snapshot)
MarketBeat reports that the average 12-month PLUG stock forecast among brokers that updated coverage in the prior year stands at about $2.73, with individual objectives ranging from roughly $0.75 to $7. The service pairs this with an overall Hold recommendation, as analysts weigh dilution risk and cash burn against potential growth in hydrogen and fuel cell deployments (MarketBeat, 16 February 2026).
Benzinga (analyst survey summary)
Benzinga states that Plug Power carried a Hold consensus rating with a mean price target of $3.98 based on 30 analyst ratings. However, the three most recent notes from TD Cowen, Clear Street and Canaccord Genuity averaged closer to $2.50. The report describes sentiment as cautious, citing profitability challenges and cost pressures, including tariffs on components used in Plug Power’s supply chain (Benzinga, 2 February 2026).
Public.com (Wall Street target consolidation)
Public.com indicates that Wall Street analysts had set a consolidated Plug Power price target of around $2.10 over a one-year horizon from then-prevailing levels. The platform explains that this figure aggregates recent brokerage estimates as analysts reassessed the company amid governance developments and capital-raising efforts (Public.com, 5 February 2026).
CoinCodex (indicator-driven model)
CoinCodex projects an end-2026 price near $1.80, implying modest downside versus contemporaneous spot levels within its modelled distribution of possible outcomes. The service states that it uses a rules-based system built on historical price data, volatility metrics and technical indicators, rather than broker fundamental research (CoinCodex, 19 February 2026).
Predictions and third-party forecasts are inherently uncertain, as they cannot fully account for unexpected market developments. Past performance is not a reliable indicator of future results.
PLUG stock price: Technical overview
The PLUG stock price is quoted around €1.89 as of 11:46am UTC on 19 February 2026, holding just above the intraday pivot band. At this snapshot, the price trades below its short- and medium-term moving averages. On the daily chart, the key simple moving average cluster sits above spot, with the 20/50/100/200-day moving averages at roughly €2.13, €2.18, €2.47 and €1.93 respectively. This configuration leaves the broader trend under pressure, although a Hull moving average near €1.80 has started to stabilise.
The 14-day relative strength index (RSI) stands near 40.7 in the lower-neutral band. An average directional index (ADX) reading around 15.8 indicates a relatively weak directional trend, suggesting consolidation rather than a strong trend phase.
On the upside, the nearest classic pivot resistance sits around €2.45 (R1). A sustained move above that area would bring the €2.89 (R2) region into focus. On pullbacks, initial support lies near the classic pivot at approximately €2.26, while the 200-day simple moving average around €1.93 may act as a secondary reference level. A break below that longer-term average could expose the €2.06 S1 zone (TradingView, 19 February 2026).
This technical analysis is provided for informational purposes only and does not constitute financial advice or a recommendation to buy or sell any instrument.
Plug Power share price history (2024–2026)
PLUG’s stock price has shown significant volatility over the past two years, moving between sub-€1 levels and the €3–€5 range before returning below €2 in early 2026. The stock closed at €3.40 on 21 February 2024 and rose to around €5.11 on 14 May 2024. It then declined through the second half of the year to finish 2024 at €2.17 on 31 December.
In 2025, PLUG briefly traded below €1 in early June, closing at €0.98 on 6 June. The price later recovered into the autumn, reaching the €4 area with prices between €4.06 and €4.23 in mid-October. By 31 December 2025, the stock had pulled back to €1.99. As of 19 February 2026, it trades at €1.89 – slightly above the €1.79 close recorded on 19 February 2025, but below the highs seen in mid-2024.
Past performance is not a reliable indicator of future results. Share prices are indicative and may differ from live market prices.
Plug Power (PLUG): Capital.com analyst view
Plug Power’s price action over the past two years illustrates how sensitive the stock can be to shifts in sentiment around hydrogen demand, funding conditions and broader growth-equity dynamics. The move from below €1 in June 2025 towards the €3–€4 area later that year, followed by a return to around €1.89 by 19 February 2026, shows how expectations can adjust as project updates, balance sheet developments and macro conditions evolve.
Ongoing factors include capital requirements, execution risk, policy support for clean energy initiatives and wider risk appetite in equity markets. Each can influence price direction, and outcomes remain uncertain.
In the near term, PLUG trades below several key daily moving averages and momentum indicators sit in neutral territory. This configuration suggests a balanced technical backdrop where new information could shift sentiment in either direction. Developments related to project delivery, funding arrangements or sector demand could support prices, while adverse updates on cash flow, delays or financing could weigh on the stock.
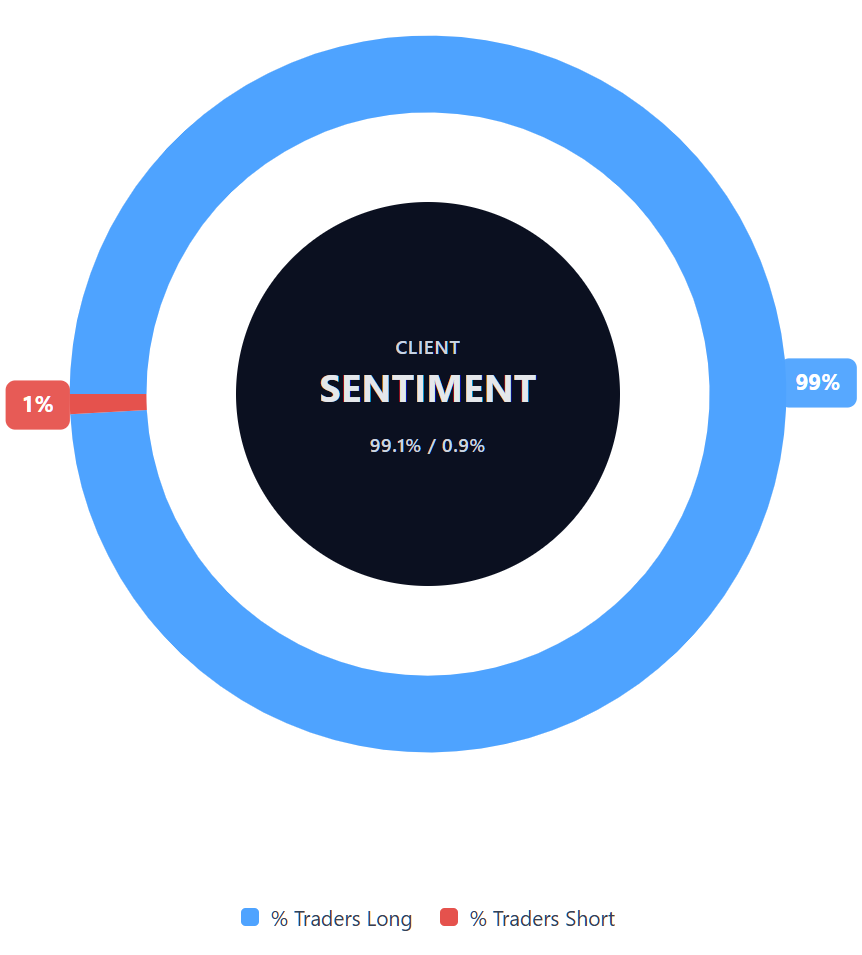
Capital.com’s client sentiment for Plug Power CFDs
As of 19 February 2026, Capital.com client positioning in Plug Power CFDs shows 99.1% buyers versus 0.9% sellers. This positioning reflects open client accounts on the platform at the time of writing and may change as market conditions evolve. Client sentiment data does not indicate future price direction.
Summary – Plug Power 2026
- Plug Power’s share price has moved within a broad and volatile range over the past two years, trading between below €1 and above €4 before returning to around €1.89 in February 2026.
- Daily technical indicators show the price below several short- and medium-term moving averages, with the 20-, 50- and 100-day averages clustered between €2.13 and €2.47, and RSI (14) in a lower-neutral band near 40.7.
- Key drivers cited by analysts and commentators include funding requirements, hydrogen project execution, policy support for clean energy and broader equity market sentiment. Each factor can influence price performance depending on how it develops.
- Newsflow in early 2026 has centred on shareholder votes to increase authorised share capital, adjourned special meetings and securities class-action filings linked to past disclosures, contributing to an elevated level of uncertainty around the stock.
Past performance is not a reliable indicator of future results.
FAQ
Who owns the most Plug Power stock?
Public filings show that Plug Power’s largest shareholders tend to be institutional investors, such as asset managers and investment funds, alongside company insiders and retail investors. Ownership levels can change over time as funds adjust their allocations or as the company issues additional shares. Investors can review the latest annual and quarterly filings to see updated breakdowns of institutional holdings, insider ownership and overall share distribution.
What is the five-year Plug Power share price forecast?
Five-year PLUG stock forecasts vary significantly across third-party models. While some scenario-based projections outline wide upside ranges, others remain more conservative and cluster closer to recent trading levels. Longer-term forecasts depend on assumptions around funding, project execution, hydrogen demand and broader equity market conditions. As these factors can change materially over time, long-term projections should be treated as illustrative rather than definitive.
Is Plug Power a good stock to buy?
Whether Plug Power may be suitable as an investment depends on an individual’s objectives, risk tolerance and time horizon. The company operates in the hydrogen sector, which can experience high volatility linked to policy support, funding conditions and project delivery. Recent price action highlights both sharp rallies and pronounced pullbacks. Investors should assess the risks, including potential dilution and execution uncertainty, before making any investment decision.
Could Plug Power stock go up or down?
Plug Power’s share price can move in either direction, sometimes within short periods. Technical indicators currently show a mixed backdrop, while analyst price targets span a broad range. Future movements may depend on developments such as capital-raising activity, project updates, regulatory changes and overall market sentiment. As with other growth-oriented stocks, volatility can be elevated and outcomes remain uncertain.
Should I invest in Plug Power stock?
Deciding whether to invest in Plug Power requires careful consideration of your financial situation, experience and tolerance for risk. The stock has demonstrated significant volatility over the past two years, reflecting changing expectations around funding and sector growth. This information is provided for educational purposes only and does not constitute financial advice. You may wish to seek independent advice before making investment decisions.
Can I trade Plug Power CFDs on Capital.com?
Yes, you can trade Plug Power CFDs on Capital.com. Trading share CFDs lets you speculate on price movements without owning the underlying asset and to take long or short positions. However, contracts for difference (CFDs) are traded on margin, and leverage amplifies both profits and losses. You should ensure you understand how CFD trading works, assess your risk tolerance, and recognise that losses can occur quickly.