Novo Nordisk stock forecast: Analysts mixed on Q4 earnings & 2026 guidance
Novo Nordisk is a Denmark-based pharmaceutical company listed in Copenhagen and New York, specialising in diabetes and obesity treatments, with revenues closely linked to its GLP-1 therapy portfolio. Explore third-party NVO price targets and technical analysis.
Novo Nordisk A/S (NVO) is trading around $48.69 as of 2:19pm UTC on 19 February 2026, moving within an intraday range of $48.56–$49.30 on Capital.com’s platform. Past performance is not a reliable indicator of future results.
Price action follows mixed reactions to Novo Nordisk’s 2025 results and 2026 guidance. The company reported 10% sales growth and 6% operating profit growth at constant exchange rates for 2025, but indicated that adjusted sales and operating profit may decline by 5–13% in 2026 (GlobeNewswire, 3 February 2026). The backdrop also includes regulatory momentum for its obesity franchise after the European Commission approved a higher 7.2mg once-weekly dose of Wegovy for adults with obesity, following clinical data showing average weight loss of about 21% (Forbes, 17 February 2026). Broader sector sentiment reflects a rapidly expanding global market for anti-obesity drugs and GLP-1 therapies, which analysts expect to grow at a robust pace over the coming decade (Reuters, 12 February 2026).
Novo Nordisk stock forecast 2026–2030: Third-party price targets
As of 19 February 2026, third-party Novo Nordisk stock predictions show a wide dispersion of views following the company’s 2026 guidance and obesity-drug pricing pressure. Recent updates cover both the New York-listed NVO ADR and the Copenhagen-listed shares. The summaries below draw on publicly reported targets and consensus figures from January–February 2026 and illustrate how brokers weigh near-term pricing headwinds against longer-term GLP-1 demand.
BMO Capital (12-month target reaffirmed)
BMO Capital reiterates a Market Perform rating on Novo Nordisk with a 12-month price target of $57 for NVO. The analyst notes that 2026 revenue is projected to decline by about 6% amid ‘extensive pricing headwinds’ in the US obesity market, as the company offers concessions to preserve market access following Trump administration most-favoured-nation (MFN) agreements (Investing.com, 4 February 2026).
Wall Street consensus via Intellectia (ADR average)
Intellectia reports that Wall Street analysts hold an average NVO stock forecast of $57.40, based on a range from $46 to $70 and a consensus ‘Moderate Buy’ stance. The service states that analysts see roughly 15% implied upside from recent levels, while also describing the 2026 guidance revision as a potential short-term headwind within a structurally growing diabetes and obesity market (Intellectia AI, 15 February 2026).
DirectorsTalk Interviews (analyst spread and upside)
DirectorsTalk Interviews cites data on 13 covering analysts, indicating an average NVO target price of $54.35 and a mix of seven Buy, five Hold and one Sell recommendations. The article references about 9.64% implied upside from the then-current share price and describes sentiment as mixed following updated guidance and ongoing sector-wide pricing discussions (DirectorsTalk Interviews, 16 February 2026).
TIKR (valuation-model target)
TIKR outlines a valuation-based scenario in which Novo Nordisk’s shares could justify a target price of $62, implying about 24% total upside and roughly 8% annualised returns from the reference level used in its model. The analysis assumes sustained obesity-drug demand and continued earnings growth, while acknowledging that price reductions, competitive pressure in GLP-1 therapies and execution risks could lead to outcomes that differ from the modelled scenario (TIKR, 16 February 2026).
Benzinga (consensus context and higher target)
Benzinga states that 14 analysts then tracked the stock with a consensus price target of $80.72, implying significant upside from the share price level cited in that report. The article links this to Novo Nordisk’s position in diabetes and obesity care, while also noting trade tariffs on US pharmaceutical imports and pricing pressure as factors that may weigh on performance (Benzinga, 5 February 2026).
Predictions and third-party forecasts are inherently uncertain, as they cannot fully account for unexpected market developments. Past performance is not a reliable indicator of future results.
NVO stock price: Technical overview
The NVO stock price is trading around $48.69 as of 2:19pm UTC on 19 February 2026 and remains below its main simple moving average cluster. The 10-, 20-, 50-, 100- and 200-day SMAs stand near 48.25, 54.08, 53.36, 52.72 and 58.07 respectively. The equivalent EMAs mostly sit above their SMA counterparts, with the 10-day EMA near 50.10 and the 200-day EMA around 60.35, indicating that price currently trades beneath key longer-term trend measures.
Momentum indicators point to a measured trend environment. The 14-day RSI sits near 41 in the lower-neutral zone, while the ADX at around 26 suggests an established, but not extreme, directional move. On the upside, the nearest classic resistance level (R1) appears around 65.27, with R2 near 71.09 requiring a sustained move through the first resistance band. On the downside, the classic pivot at approximately 58.33 and the 200-day SMA near 58.07 mark reference levels above the current price, while S1 around 52.51 may act as a technical reference if price revisits that zone (TradingView, 19 February 2026).
This technical analysis is provided for informational purposes only and does not constitute financial advice or a recommendation to buy or sell any instrument.
Novo Nordisk share price history (2024–2026)
Novo Nordisk’s US-listed ADR (NVO stock price) has recorded a significant swing over the past two years, moving from triple-digit territory in 2024 to the high-$40s by mid-February 2026. The stock closed at $121.01 on 21 February 2024, rose to a two-year closing high of $146.98 on 25 June 2024, and then ended 2024 at $86.22 on 31 December. After briefly returning to the mid-$90s in early March 2025, it trended lower through the remainder of the year and into 2026, closing around $83.55 on 3 February 2025, $59.35 on 1 October 2025 and $50.90 on 31 December 2025.
In 2026 to date, volatility has remained elevated around pricing and guidance updates. The ADR opened the year at $52.49 on 2 January, rose to $64.05 on 26 January, and then declined from $59.05 on 2 February to $44.55 on 5 February before recovering into the high-$40s. As of 19 February 2026, NVO closed at $48.63, leaving it well below its mid-2024 peak but broadly in line with levels seen in late 2025.
Past performance is not a reliable indicator of future results. Share prices are indicative and may differ from live market prices.
Novo Nordisk (NVO): Capital.com analyst view
Novo Nordisk’s ADR price has shifted from sustained triple-digit levels to the high-$40s over the past two years, reflecting a reset in growth expectations, pricing assumptions and valuation multiples. The decline from above $140 in mid-2024 to below $50 by February 2026 coincides with updated guidance and evolving sector sentiment, suggesting that earlier growth expectations have been reassessed by the market.
Recent trading in 2026 has been volatile, with the price moving from around $59 at the start of February to the mid-$40s before stabilising near $48–$49 in mid-February. Some traders may view guidance revisions, pricing pressure and competition as ongoing downside risks, while others may focus on Novo Nordisk’s established portfolio and structural demand for GLP-1 therapies. In either case, short-term price movements can diverge from expectations, particularly in response to new clinical data, regulatory developments or broader market shifts.
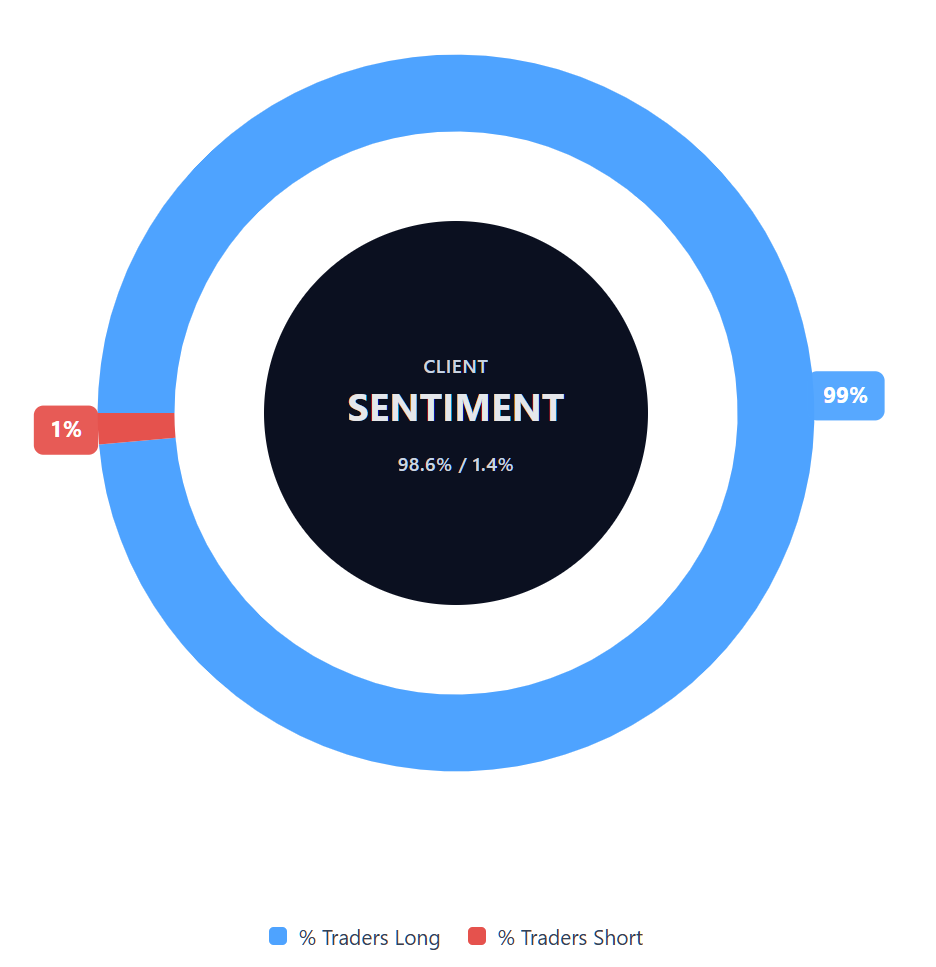
Capital.com’s client sentiment for Novo Nordisk CFDs
As of 19 February 2026, Capital.com client positioning in Novo Nordisk CFDs is weighted towards long positions, with buyers accounting for 98.6% and sellers 1.4% of open CFD positions, a difference of approximately 97 percentage points. This snapshot reflects live positioning data on Capital.com and may change as clients open, close or hedge positions.
Summary – Novo Nordisk 2026
- Novo Nordisk’s ADR declined from above $140 in mid-2024 to close 2024 at $86.22, before falling further to the high-$40s by mid-February 2026.
- Technical indicators show NVO trading below its 50-, 100- and 200-day moving averages, with the 14-day RSI in lower-neutral territory and the ADX signalling an established trend rather than range-bound conditions.
- Price movements reflect revised 2026 sales and profit guidance, competitive dynamics in GLP-1 therapies and obesity-drug pricing discussions, alongside broader shifts in large-cap pharmaceutical stocks and macroeconomic sentiment.
- Recent developments include the company’s 2025 results, updated 2026 outlook and European approval of a higher-dose Wegovy regimen, all of which have contributed to renewed debate around near-term earnings visibility and longer-term growth prospects.
Past performance is not a reliable indicator of future results.
FAQ
Who owns the most Novo Nordisk stock?
Novo Nordisk operates a dual-share structure, and the Novo Nordisk Foundation, through its investment arm, retains control through majority voting rights rather than simply economic ownership. This structure gives the foundation significant influence over strategic decisions. In addition, large institutional investors, including global asset managers and pension funds, hold substantial positions in the publicly traded shares and ADRs. Ownership levels can change over time as funds rebalance portfolios and as market conditions evolve.
What is the 5 year Novo Nordisk share price forecast?
Five-year NVO stock forecasts vary widely and depend on the assumptions used in each model. Some longer-dated, model-based projections outline higher price scenarios by 2030, while others emphasise uncertainty around pricing, competition and regulation. These projections rely on historical data and growth assumptions that may not materialise. As a result, long-term forecasts are best viewed as scenario-based estimates rather than precise predictions.
Is Novo Nordisk a good stock to buy?
Whether Novo Nordisk is considered ‘good’ depends on individual objectives, risk tolerance and time horizon. The company operates in diabetes and obesity markets that analysts describe as structurally growing, but recent guidance revisions and pricing pressures have influenced expectations. Share price performance has also been volatile over the past two years. Investors and traders typically assess fundamentals, valuation, competitive dynamics and broader market conditions before making decisions, while recognising that both gains and losses are possible.
Could Novo Nordisk stock go up or down?
Novo Nordisk’s share price could move in either direction, influenced by earnings updates, regulatory decisions, clinical trial data, pricing developments and broader market conditions. Technical indicators show the stock trading below several longer-term moving averages, while published analyst targets span a broad range. This dispersion reflects differing assumptions about future revenues and margins, which means price movements may remain sensitive to new information.
Should I invest in Novo Nordisk stock?
Deciding whether to invest in Novo Nordisk requires careful consideration of your financial situation, objectives and risk tolerance. Shares and CFDs are exposed to market risk, and prices can rise or fall. You may wish to review the company’s financial results, competitive position and sector outlook, and consider seeking independent financial advice if appropriate. This information is for educational purposes only and does not constitute investment advice.
Can I trade Novo Nordisk CFDs on Capital.com?
Yes, you can trade Novo Nordisk CFDs on Capital.com. Trading share CFDs lets you speculate on price movements without owning the underlying asset and to take long or short positions. However, contracts for difference (CFDs) are traded on margin, and leverage amplifies both profits and losses. You should ensure you understand how CFD trading works, assess your risk tolerance, and recognise that losses can occur quickly.