Microsoft stock forecast: Could AI strategy influence MSFT outlook?
Microsoft Corporation is a US-listed multinational technology company, trading on the Nasdaq under the ticker MSFT, with business lines spanning cloud services, software, hardware and artificial intelligence. Explore third-party MSFT price targets and technical analysis.
Microsoft Corp. (MSFT) is trading around $399.58 in early Thursday dealing, fluctuating between an intraday low of $395.98 and a high of $401.70 as of 10:27am UTC on 19 February 2026. Past performance is not a reliable indicator of future results.
Price action reflects continued focus on Microsoft’s fiscal Q2 2026 results. The company reported revenue of about $81.3bn, up roughly 17% year on year, and highlighted Microsoft Cloud revenue of approximately $51.5bn, up around 26% (Microsoft, 28 January 2026). Trading activity also coincides with Microsoft’s $0.91 per share cash dividend, with an ex-dividend date of 19 February 2026 (Investing.com, 2 December 2025), and with broader US equity sentiment after the US Tech 100 closed near 22,753.6 earlier in the week (Trading Economics, 19 February 2026).
Microsoft stock forecast 2026–2030: Third-party price targets
As of 19 February 2026, third-party Microsoft stock predictions range from $392 to $675 on a 12-month horizon. Estimates vary widely, reflecting different assumptions about growth, margins and valuation. The following summaries outline selected targets and the reasoning cited in recent broker and aggregator updates.
Stifel (target cut)
Stifel lowers its 12-month Microsoft price target to $392 from $540. The firm is reported to adopt a more conservative stance on valuation following recent earnings and the stock’s pullback (Yahoo Finance, 5 February 2026).
Stock Analysis (aggregated view)
StockAnalysis reports that 33 analysts assign an average 12-month MSFT stock forecast of about $603.27, with individual targets ranging from $392 to $675. The service describes this distribution as a ‘Strong Buy’ consensus rating, based on aggregated analyst recommendations, alongside expectations for continued expansion in Microsoft’s AI and cloud segments (Stock Analysis, 17 February 2026).
Morgan Stanley (house view via press coverage)
Morgan Stanley sets a Microsoft price target of $650, describing it as one of the higher published targets at the time. The firm links its view to expectations around Azure performance and AI-related margin trends, while acknowledging that such projections depend on execution and broader market conditions (Investing.com, 14 January 2026).
Intellectia.ai (aggregated analyst range)
Intellectia.ai writes that Wall Street analyst targets for Microsoft generally fall between approximately $400 and $676, with an average 12-month range around $595-$603. The article cites consensus expectations around AI and cloud development, as well as commentary on Microsoft’s cash position and partnerships, as factors referenced by analysts (Intellectia AI, 17 February 2026).
Predictions and third-party forecasts are inherently uncertain, as they cannot fully account for unexpected market developments. Past performance is not a reliable indicator of future results.
MSFT stock price: Technical overview
On the daily chart at 10:27am UTC on 19 February 2026, the MSFT stock price trades below its primary moving average cluster, with the 20-, 50-, 100- and 200-day simple moving averages (SMAs) around 427, 458, 483 and 487 respectively. This positioning leaves price beneath a key technical band. The 14-day relative strength index (RSI) near 32.9 sits in lower-neutral territory, while an average directional index (ADX) reading around 35.7 indicates a defined trend rather than range-bound conditions.
On the topside, the first reference level is the classic R1 pivot near 473. A sustained daily close above that level would bring the R2 area around 516 into focus. On pullbacks, the classic pivot near 447 may act as initial support, with the S1 zone around 404 attracting attention if prices close below that region (TradingView, 19 February 2026).
This technical discussion is for informational purposes only and does not constitute financial advice or a recommendation to buy or sell any instrument.
Microsoft share price history (2024–2026)
MSFT’s stock price has shifted notably over the past two years. In early 2024, it traded in a relatively tight range around $420-$440. The stock closed at $403.60 on 21 February 2024, then moved gradually higher through mid-2024, testing the mid-$420s before pushing into the $430-$450 area by late March and April 2024.
Through the second half of 2024 and into late 2025, MSFT generally held above $400 and spent extended periods above $430. It later broke higher, reaching closing levels above $540-$550 in July and October 2025. After the October peak near $547.25 on an intraday basis, price retreated below $500 by December 2025 and declined further in January-February 2026, standing at $400.21 on 19 February 2026, compared with $415 one year earlier.
Past performance is not a reliable indicator of future results. Share prices are indicative and may differ from live market prices.
Microsoft (MSFT): Capital.com analyst view
Over the past two years, Microsoft’s share price has combined periods of sustained upside with phases of consolidation and, more recently, a pronounced pullback. The advance from the low-$400s in early 2024 to above $540-$550 in parts of 2025 was followed by a retracement towards $400 in early 2026. This sequence illustrates how large-cap technology stocks can experience sizeable swings, even after extended rallies.
Looking ahead, market participants may continue to monitor AI adoption trends, cloud demand, enterprise IT spending, interest rate expectations and broader equity sentiment. Stronger revenue growth or margin expansion in key segments could support valuations, while slower spending, regulatory developments or increased competition could weigh on performance or contribute to volatility. Past performance is not a reliable indicator of future results.
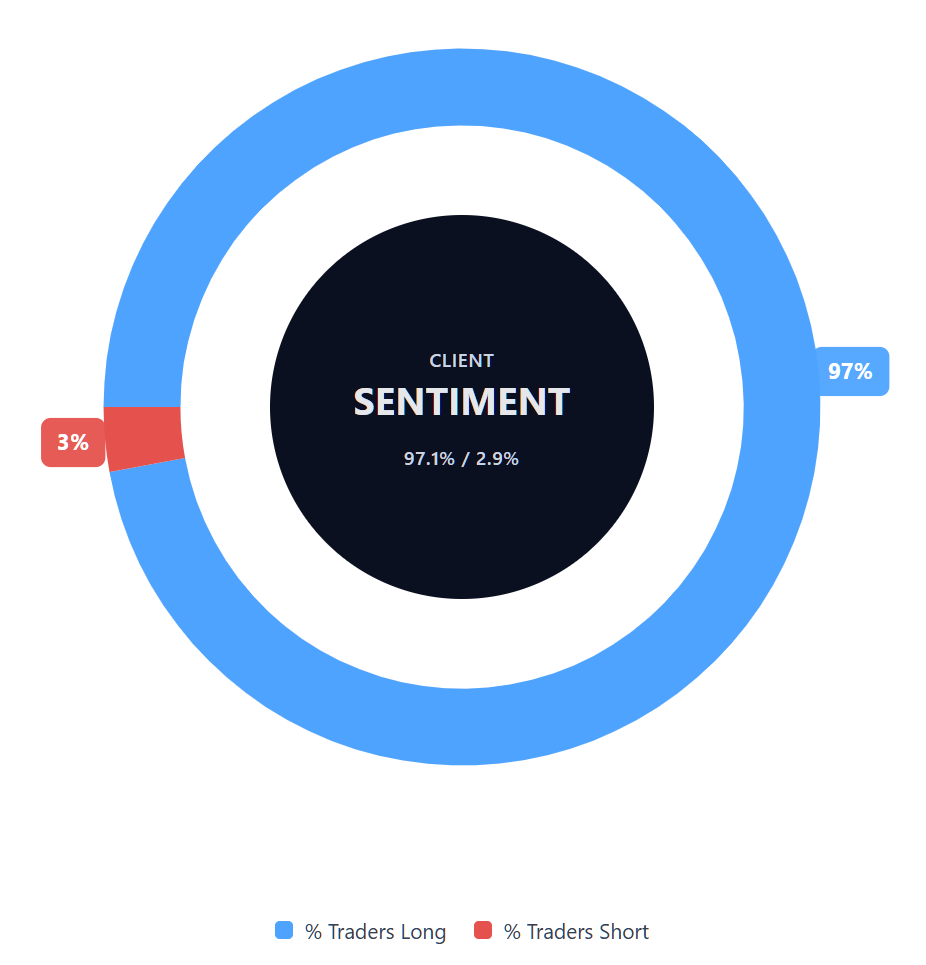
Capital.com’s client sentiment for Microsoft CFDs
As of 19 February 2026, Capital.com client positioning in Microsoft CFDs currently shows 97.1% buyers versus 2.9% sellers, leaving a difference of around 94.1 percentage points in favour of long positions. This snapshot reflects open positions on the platform at the time of writing and can change. Client sentiment data does not predict future price direction and should be considered alongside other analysis.
Summary – Microsoft 2026
- As of 19 February 2026, Microsoft trades near $400, below its late-2025 highs, underscoring how quickly price dynamics can shift in large-cap technology stocks.
- Technical indicators show the share price trading beneath key daily moving averages, with RSI in lower-neutral territory and ADX signalling an established trend rather than a sideways range.
- Key drivers include developments in AI and cloud investment, corporate capital expenditure cycles, interest rate expectations and broader US equity sentiment, all of which may influence volatility.
- Recent commentary has focused on quarterly earnings and AI-related capital expenditure plans.
Past performance is not a reliable indicator of future results.
FAQ
Who owns the most Microsoft stock?
Microsoft’s largest shareholders typically include major institutional investors such as asset managers and index fund providers. Firms such as Vanguard and BlackRock have historically held significant stakes through mutual funds and exchange-traded funds. Senior executives and board members also hold shares, although their ownership is smaller by comparison. Ownership levels can change over time as institutions rebalance portfolios or adjust exposure in response to market conditions.
What is the 5 year Microsoft share price forecast?
There is no single, reliable five-year MSFT stock forecast. Most published analyst targets focus on a 12-month horizon, and even these estimates vary widely depending on assumptions about revenue growth, margins, capital expenditure and broader market conditions. Longer-term projections carry additional uncertainty, as they depend on factors such as AI adoption, cloud demand, regulation and macroeconomic trends, all of which can evolve significantly over time.
Is Microsoft a good stock to buy?
Whether Microsoft is considered a ‘good’ stock depends on an individual’s objectives, risk tolerance and investment horizon. Analysts often highlight its cloud and AI exposure, financial position and market presence, but they also reference valuation risks, competition and shifting macroeconomic conditions. Share prices can rise or fall, and past performance does not guarantee future results. This information is provided for general purposes only and does not constitute investment advice.
Could Microsoft stock go up or down?
Microsoft’s share price can move in either direction. Factors such as earnings results, guidance updates, developments in AI and cloud services, interest rate expectations and overall US equity sentiment may influence price action. Technical indicators, including moving averages and RSI levels, can provide context but do not predict outcomes. Volatility is common in large-cap technology stocks, particularly around major announcements or shifts in broader market conditions.
Should I invest in Microsoft stock?
Deciding whether to invest in Microsoft shares depends on your financial goals, time horizon and tolerance for risk. Shares can offer exposure to the company’s performance, but they also carry market risk and the potential for losses. If you are unsure, you may wish to seek independent financial advice. Any decision should be based on your own research and understanding of the associated risks.
Can I trade Microsoft CFDs on Capital.com?
Yes, you can trade Microsoft CFDs on Capital.com. Trading share CFDs lets you speculate on price movements without owning the underlying asset and to take long or short positions. However, contracts for difference (CFDs) are traded on margin, and leverage amplifies both profits and losses. You should ensure you understand how CFD trading works, assess your risk tolerance, and recognise that losses can occur quickly.