Leonardo stock forecast: Third-party price targets
Leonardo S.p.A. is an Italian-listed aerospace and defence company on the Borsa Italiana, generating revenue from helicopters, aircraft, electronics and security systems across domestic and international markets. Explore third-party LDO price targets and technical analysis.
Leonardo S.p.A (LDO) is trading around €54.00 as of 10:18am on 12 February 2026 (UTC), within an intraday range of approximately €52.40–€54.46 on Capital.com’s EUR-denominated Stock CFD market feed. Past performance is not a reliable indicator of future results.
The stock is moving amid recent company developments, including Leonardo’s January 2026 agreement, through its US subsidiary, to acquire Enterprise Electronics Corporation to expand its weather radar and environmental systems capabilities (Leonardo, 16 January 2026), alongside a February 2026 strategic partnership with Adani Defence & Aerospace to develop India’s helicopter ecosystem (Vertical Mag, 6 February 2026).
Leonardo stock forecast 2026–2030: Third-party price targets
As of 12 February 2026, third-party Leonardo stock predictions show a range of 12-month estimates clustered between the mid-€50s and low-€70s, based on broker research, data-vendor consensus and curated summaries. These figures represent third-party opinions and may differ from Capital.com’s pricing and internal assessments.
Simply Wall St (valuation review)
Simply Wall St outlines potential upside for Leonardo using a one-year price target of approximately €62, implying double-digit percentage headroom versus the then spot price. The analysis links this higher target to projected free cash flow growth through 2030 and scenarios for continued revenue expansion in the defence segment (Simply Wall St, 7 January 2026).
TIKR (house model output)
TIKR cites a €71 target price for Leonardo, describing this as implying about 21% potential upside from a contemporaneous price of €58. The commentary states that this target is derived from TIKR’s valuation model under assumptions that revenue growth and margins remain close to projected levels over the next two years (TIKR, 17 January 2026).
Fintel (consensus one-year target snapshot)
Fintel’s LDO stock forecast page reports an average one-year price target of €60.51, with individual analyst estimates ranging from €48.88 to €74.55. The service indicates that this dispersion reflects differing analyst expectations regarding earnings growth, margin trends and capital allocation, set against European defence spending dynamics (Fintel, 5 February 2026).
MarketBeat (US OTC line and broker move)
MarketBeat’s update on Leonardo’s US-traded line, FINMY, references Deutsche Bank’s rating change alongside an updated local-currency target equivalent to the low-€60s for the Milan listing, based on cross-referenced coverage. The note attributes this revision to the bank’s reassessment of upside following a strong price run, citing order backlog, profitability trends and sector valuations (MarketBeat, 22 January 2026).
Predictions and third-party forecasts are inherently uncertain, as they cannot fully account for unexpected market developments. Past performance is not a reliable indicator of future results.
LDO stock price: Technical overview
The LDO stock price is trading around €54.00 as of 10:18am on 12 February 2026 (UTC), sitting just below a tight short-term moving-average cluster, with the 20-, 50-, 100- and 200-day simple moving averages (SMAs) near 56.3, 53.0, 52.1 and 50.3 respectively. The 14-day relative strength index (RSI), at around 47, signals neutral momentum, while the average directional index (ADX), near 18.9, suggests that any prevailing trend remains relatively weak.
On the topside, the first classic pivot level to monitor sits near 61.8, with R2 around 67.3 coming into focus only after a sustained daily close above that initial resistance zone. The central pivot near 55.5 marks an area of initial support, followed by the 100-day SMA close to 52.1 as the next potential technical reference point. A move below S1 around 50.0 would place attention on the lower S2 region near 43.7 (TradingView, 12 February 2026).
This technical analysis is provided for informational purposes only and does not constitute financial advice or a recommendation to buy or sell any instrument.
Leonardo share price history (2024–2026)
LDO’s stock price has undergone a significant re-rating over the past two years, rising from around €18.30 in mid-February 2024 to approximately €29.80 by 12 February 2025, before advancing further to about €54.10 by 12 February 2026. Over this period, the stock transitioned from trading largely within the high-teens and low-twenties to establishing a more sustained upward trajectory.
The move higher has not been linear. For example, the price retraced towards the mid-€30s in early April 2025 before recovering through the €40s and €50s during the second half of 2025, illustrating that extended advances can still include pronounced pullbacks.
Past performance is not a reliable indicator of future results. Share prices are indicative and may differ from live market prices.
Leonardo (LDO): Capital.com analyst view
Leonardo’s share price has moved from the high-teens in early 2024 to the mid-€50s by February 2026, with recent price action around €54 showing periods of consolidation alongside upward momentum. This performance has coincided with renewed investor focus on European defence names and elevated trading volumes at various points, although price swings have remained material.
From a fundamental drivers’ perspective, company updates related to defence contracts, strategic partnerships and acquisitions have influenced market expectations. At the same time, such announcements can introduce execution, regulatory or geopolitical risks, which may affect valuations if outcomes differ from expectations.
Broader macroeconomic factors – including interest rate policy, fiscal budgets and shifts in overall risk appetite – can also shape the trading environment. A supportive backdrop for defence spending may underpin sector interest, while changes in spending priorities or capital flows could weigh on valuations, particularly following extended rallies.
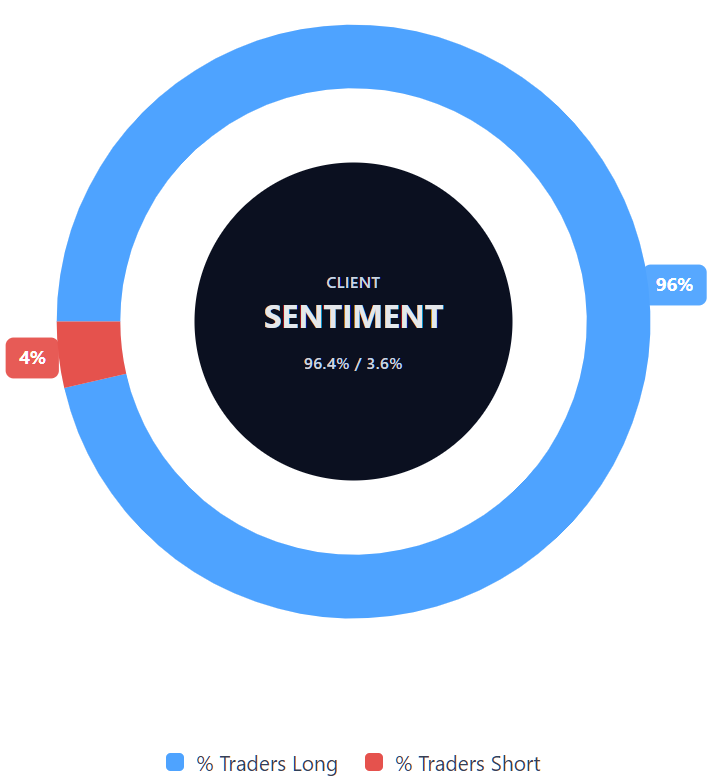
Capital.com’s client sentiment for Leonardo CFDs
As of 12 February 2026, Capital.com client positioning in Leonardo CFDs shows buyers at 96.4% versus sellers at 3.6%, indicating a predominantly long bias among active accounts, with a net long difference of around 92.8 percentage points. This snapshot reflects open positions on Capital.com at the time of writing and can change.
Summary – Leonardo 2026
- Leonardo’s share price has more than doubled over the past two years, rising from around €18 in early 2024 to the mid-€50s by February 2026, with periodic pullbacks along the way.
- As of 12 February 2026, Leonardo trades near €54 on Capital.com, just below recent intraday highs around €55, following a sustained advance through late 2025 and early 2026.
- Technical indicators place the price just under a short-term moving-average cluster, with RSI in neutral territory. Classic pivot levels identify potential resistance near €61.8, while support levels appear around €55.5 and €52.1, based on current calculations.
Past performance is not a reliable indicator of future results.
FAQ
Who owns the most Leonardo stock?
Leonardo S.p.A. has a diversified shareholder base that includes institutional investors, asset managers and retail shareholders. As an Italian-listed defence and aerospace group, the Italian Ministry of Economy and Finance has historically remained a significant shareholder. Ownership levels can change over time due to market transactions and regulatory disclosures, so investors should consult the latest filings and company reports for the most up-to-date breakdown.
What is the five-year Leonardo share price forecast?
There is no single agreed five-year LDO stock forecast. Most publicly available analyst targets focus on 12-month projections rather than longer-term horizons. Over a five-year period, performance would likely depend on factors such as defence spending trends, order-book execution, margin development, cash generation and broader macroeconomic conditions. Long-term projections are inherently uncertain and may change materially as new information becomes available.
Is Leonardo a good stock to buy?
Could Leonardo stock go up or down?
Should I invest in Leonardo stock?
Can I trade Leonardo CFDs on Capital.com?
Yes, you can trade Leonardo CFDs on Capital.com. Trading share CFDs lets you speculate on price movements without owning the underlying asset and to take long or short positions. However, contracts for difference (CFDs) are traded on margin, and leverage amplifies both profits and losses. You should ensure you understand how CFD trading works, assess your risk tolerance, and recognise that losses can occur quickly.