Microsoft stock forecast: $106.9bn AI capex & Azure guidance
Microsoft (MSFT) reported Q2 FY2026 revenue of $81.3bn and adjusted EPS of $4.14 on 28 January, while investors assessed Azure margin guidance and FY2026 AI capex plans. Explore third-party MSFT price targets and technical analysis. Past performance is not a reliable indicator of future results.
Microsoft (MSFT) is trading at $408.32 as of 1:01 pm UTC on 6 March 2026, within an intraday range of $402.46–$411.35. Past performance is not a reliable indicator of future results.
Sentiment has been shaped by a combination of company-specific and macro factors. In its fiscal Q2 2026 earnings, reported 28 January, Microsoft posted revenue of $81.3 billion – up 17% year-on-year (Microsoft, 28 January 2026) – with adjusted EPS of $4.14 beating the $3.97 consensus (CNBC, 28 January 2026). Broader market sentiment has also been influenced by the approaching 17–18 March FOMC meeting, with the CME FedWatch tool pricing a rate cut probability at just 4.7% (CME Group, 6 March 2026), while the US 10-year Treasury yield moved to a three-week high as of 5 March 2026; the Nasdaq 100 closed at 25,093.68 on that date (Trading Economics, 6 March 2026).
Microsoft stock forecast 2026–2030: Third-party price targets
As of 6 March 2026, third-party Microsoft stock predictions reflect a wide range of views shaped by cloud growth trajectories, AI capital expenditure commitments, and near-term competitive pressures in the Azure segment. The following targets summarise leading forecasts published in February and March 2026.
Melius Research (downgrade, revised target)
Melius Research revises its MSFT rating from Buy to Hold and sets a price target of $430, citing concerns that Microsoft's 365 segment could face structural pressure from AI-driven alternatives. The firm also notes that Microsoft may need to substantially increase capital spending to stay competitive with Alphabet and Amazon, which it says risks compressing free cash flow (Yahoo Finance, 4 March 2026).
Fintel (consensus snapshot)
Fintel reports that the average one-year price MSFT stock forecast across tracked analysts stands at around $608.86, within a range of $395/92 on the low end to $766.50 on the high end. The consensus reflects a broad buy skew, as the majority of contributing analysts maintain constructive ratings despite a handful of recent downgrades amid Azure uncertainty (Fintel, 6 March 2026).
Public.com (consensus overview)
Public.com aggregates ratings from 31 analysts and reports a consensus Buy rating with an average 12-month price target of $595.90. The platform notes that Microsoft's Azure segment posted 39% year-on-year growth (38% in constant-currency terms) in fiscal Q2, with commercial remaining performance obligations up $233 billion year-on-year, underpinning revenue visibility in the cloud division (Public.com, 4 March 2026).
MarketBeat (consensus tracker)
MarketBeat tracks 36 Wall Street analysts and reports a consensus Moderate Buy rating with an average 12-month price target of $591.95, spanning a low of $475 to a high of $710. The aggregator notes that 33 of the 36 analysts hold a Buy rating, with the distribution tilted firmly constructive even as two recent Hold calls from Stifel and Melius Research have pulled the average target lower from earlier levels above $600 (MarketBeat, 5 March 2026).
Predictions and third-party forecasts are inherently uncertain, as they cannot fully account for unexpected market developments. Past performance is not a reliable indicator of future results.
MSFT stock price: Technical overview
The MSFT stock price trades at $408.32 as of 1:01 pm UTC on 6 March 2026, within an intraday range of $402.46–$411.35. Price sits above the 10- and 20-day simple moving averages (SMAs) at around $398 and around $400 respectively, but trades well beneath the 30/50/100/200-day SMAs at around $416 / $439 / $470 / $485, a configuration that keeps the medium- and longer-term MA structure in a sell alignment. The 20-over-10 arrangement in the short-term band offers a modestly constructive near-term read, though the broader picture is one of price trading inside a wide MA gap.
Momentum is mixed. The 14-day relative strength index (RSI) reads 48.35, a neutral reading that does not indicate trending conviction in either direction. The average directional index (ADX) at 28.41 suggests an established trend is present, though the directional signal alone does not indicate its orientation given the conflicting MA structure above.
On the topside, the classic R1 pivot at $421.75 is the first meaningful reference; a daily close above that level would bring R2 at $450.75 into focus from a technical perspective. The $411 intraday high and the nearby round figure at $415–$416 (30-day SMA) represent intervening resistance before R1 is tested.
On pullbacks, the classic pivot (P) at $401.73 serves as initial support, broadly confluent with the volume-weighted moving average at around $400 and the 20-day SMA at around $400. Losing that zone on a closing basis would risk a move toward S1 at $372.72, with the 100-day SMA at around $470 remaining a distant overhead anchor rather than a nearby floor given the current price location well beneath it (TradingView, 6 March 2026).
This is technical analysis for informational purposes only and does not constitute financial advice or a recommendation to buy or sell any instrument.
Microsoft share price history (2024–2026)
MSFT’s stock price opened March 2024 around $408, then moved through a volatile 2025. After sliding during a broader market sell-off, the stock hit an intraday low of $341.55 on 7 April 2025 before recovering into the $380–$400 range by late May 2025. Momentum later improved, and MSFT reached a two-year high of $557.66 intraday on 28 October 2025, with the stock comfortably above $500 for much of October and November 2025.
The picture shifted sharply in early 2026. After closing 2025 at $483.72, MSFT dropped hard through January and February, hitting an intraday low of $341.55 on 7 April 2025 during a broader market sell-off, before recovering into the $380–$400 range by late May 2025. A second leg lower followed in early 2026, with the stock sliding from $489 at the start of January to a close of $385.22 on 23 February 2026, pressured by Stifel's downgrade and Azure growth concerns.
MSFT closed at $408.51 on 6 March 2026, up approximately 0.1% year on year versus the $398.04 close on 6 March 2025, and down roughly 15.5% from its 31 December 2025 close of $483.72 year to date.
Past performance is not a reliable indicator of future results. Share prices are indicative and may differ from live market prices.
Microsoft (MSFT): Capital.com analyst view
Microsoft's price performance over the past two years reflects a stock navigating the tension between cloud and AI growth and investor scrutiny over the cost of achieving it. Azure revenue grew 39% year-on-year in fiscal Q2 2026, and Microsoft Cloud surpassed $50bn in quarterly revenue for the first time, according to the company's official earnings release. Those figures may be viewed by some investors as supportive of the underlying growth case, and the commercial backlog has more than doubled to $625bn, which some observers interpret as a durable revenue pipeline. On the other hand, capital expenditure reached $37.5bn in the quarter, a 66% year-on-year increase, and the stock fell sharply after the print as investors questioned whether returns will materialise at a pace that justifies the outlay.
The competitive landscape adds further nuance. Google Cloud posted 48% revenue growth in the same period, running ahead of Azure's 39%, and Amazon Web Services continues to press on scale. Supply constraints in Microsoft's own datacentre capacity could also limit near-term Azure revenue recognition, even as demand remains strong. Bulls point to Copilot's 15 million paid seats and the OpenAI partnership as structural differentiators; bears argue those advantages are already priced in at current multiples, particularly with the price-to-earnings ratio near a three-year low.
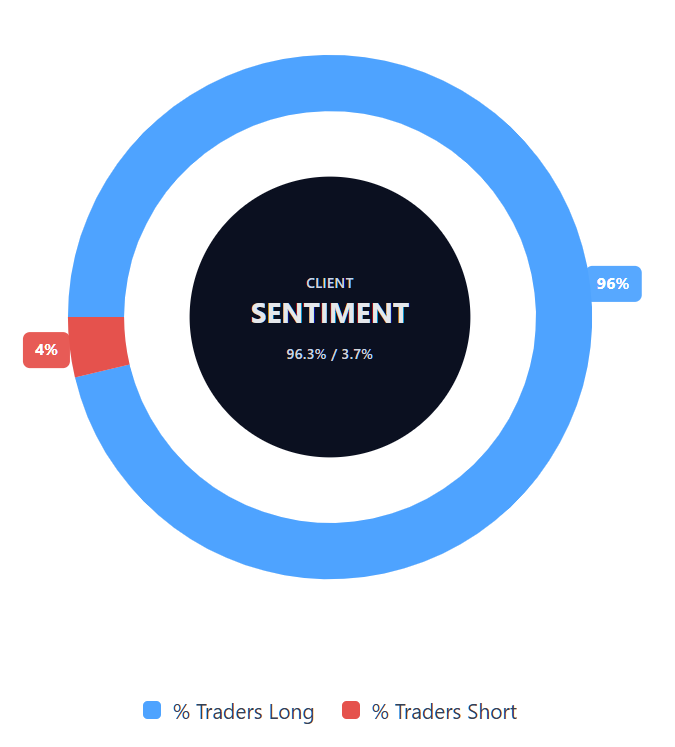
Capital.com’s client sentiment for Microsoft CFDs
As of 6 March 2026, Capital.com client positioning in Microsoft CFDs sits at 96.3% long vs 3.7% short, putting buyers ahead by 92.6 percentage points and placing sentiment firmly in long-skewed territory. This snapshot reflects open positions on Capital.com at the time of writing and can change as market conditions evolve. Extreme positioning can sometimes reflect consensus conviction, though sentiment alone does not predict price direction.
Summary – Microsoft 2026
- MSFT trades at $408.32 as of 1:01 pm UTC on 6 March 2026, down roughly 15.5% year to date from the $483.72 close on 31 December 2025.
- The stock hit a two-year intraday high of $557.66 on 28 October 2025 before a sustained decline through early 2026 brought prices back toward the $385–$410 range.
- Short-term moving averages (10- and 20-day SMAs near $398–$400) sit below current price, while the 30/50/100/200-day SMAs at $416–$485 all remain overhead resistance.
- The 14-day RSI reads 48.35, a neutral reading, while the ADX at 28.41 indicates an established trend; the classic pivot point at $401.73 serves as initial support.
- Azure revenue grew 39% year-on-year in fiscal Q2 2026 and Microsoft Cloud surpassed $50bn in quarterly revenue, supporting the underlying growth thesis.
Past performance is not a reliable indicator of future results.
FAQ
Who owns the most MSFT stock?
What is the 5 year MSFT share price forecast?
Is MSFT a good stock to buy?
Could MSFT stock go up or down?
Should I invest in MSFT stock?
Can I trade MSFT CFDs on Capital.com?
Yes, you can trade Microsoft CFDs on Capital.com. Trading share CFDs lets you speculate on price movements without owning the underlying asset and to take long or short positions. However, contracts for difference (CFDs) are traded on margin, and leverage amplifies both profits and losses. You should ensure you understand how CFD trading works, assess your risk tolerance, and recognise that losses can occur quickly.