Eni stock forecast: Third-party price targets
Eni S.p.A. is an Italian multinational energy company listed on the Borsa Italiana and the NYSE, operating across oil and gas exploration, production, refining and energy-transition projects. Explore third-party ENI price targets and technical analysis.
Eni S.p.A. (ENI) is trading around €18.33 as of 10:52am on 12 February 2026 (UTC), moving within an intraday range of €17.96-€18.39 on Capital.com’s EUR-denominated share CFD feed. Past performance is not a reliable indicator of future results.
Price action unfolds against a supportive backdrop for Italian equities, with the FTSE MIB index up about 0.6% at around 46,760 points in Thursday trading (TradingView, 12 February 2026). Firmer oil markets also provide context, as Brent crude trades near the high-$60s per barrel following recent gains (Trading Economics, 12 January 2026). On the corporate side, Eni has reported further purchases of its own shares under an ongoing buyback programme (Eni, 11 February 2026) and announced the award of a new offshore exploration licence in Libya (Eni, 11 February 2026), keeping capital returns and upstream activity in focus.
Eni stock forecast 2026–2030: Third-party price targets
As of 12 February 2026, third-party Eni stock predictions centre on the mid-teens in euro terms for the Milan-listed shares and the mid-$30s for the NYSE-listed ADR. Estimates vary, reflecting different assumptions about commodity prices, cash generation and capital-allocation priorities. The following summaries outline six published views from January-February 2026, based on publicly available broker, data-vendor and media sources.
Investing.com (consensus data)
Investing.com reports that consensus ENI stock forecast data shows an average 12-month target of about €16.70 for the Milan-listed shares, with individual estimates ranging from roughly €14.50 to €20. The service attributes this dispersion to differing oil and gas price assumptions, as well as expectations for earnings, dividends and investment plans in a volatile sector (Investing.com, 12 February 2026).
TipRanks (Wall Street coverage)
TipRanks states that 10 Wall Street analysts have issued 12-month targets for Eni, with an average of around €17.11, a high forecast of €20 and a low of €14.50. The platform describes the overall rating as Moderate Buy, noting that brokers weigh cash-flow resilience and decarbonisation initiatives against changing energy-market conditions (TipRanks, 12 February 2026).
MarketBeat (consensus for NYSE:E)
MarketBeat reports that ENI’s NYSE-listed shares carry a consensus 12-month price target of $34.60, alongside a Hold-leaning rating profile. The article notes that this level sits below the prevailing share price, as analysts reassess earnings prospects and capital-return policies following recent gains and updated oil and gas expectations (MarketBeat, 6 February 2026).
UBS (single-stock rating via press summary)
UBS analyst Joshua Stone maintains a Buy rating on ENI S.p.A. and sets a 12-month target of €18, with the shares closing at about €17.32 on the same day. The firm frames the target within Stone’s broader assessment of Eni’s position among European integrated oil and gas peers (The Globe and Mail, 5 February 2026).
Predictions and third-party forecasts are inherently uncertain, as they cannot fully account for unexpected market developments. Past performance is not a reliable indicator of future results.
ENI stock price: Technical overview
The ENI stock price trades near €18.33 as of 10:52am on 12 February 2026 (UTC), with the price above its primary moving-average cluster. The 20-, 50-, 100- and 200-day simple moving averages (SMAs) stand at approximately 17.2, 16.5, 16.0 and 15.1 respectively, indicating that the medium-term trend has moved higher. The 14-day relative strength index (RSI), at around 77.8, signals elevated momentum, while an average directional index (ADX) reading near 29 suggests an established trend rather than a range-bound market.
On the topside, the nearest classic pivot resistance sits around €17.96, with R2 near €18.69 if the price prices decisively above the immediate resistance band. On the downside, initial support appears near the central pivot around €16.81. The 100-day SMA, close to €16.04, may act as a secondary support level, and a sustained break below it could expose the S1 area near €16.08 (TradingView, 12 February 2026).
Technical analysis reflects historical price patterns and does not guarantee future outcomes. It is provided for informational purposes only and does not constitute financial advice.
Eni share price history (2024–2026)
ENI’s stock price spent much of early 2024 consolidating just below €15, with prices largely in the €13.50-€15 range and a finish around the mid-€13s in December 2024. Through 2025, trading conditions shifted from range-bound to gradually firmer. The stock hovered near €13.50 in January, dipped into the low-€12s in April, then advanced from roughly €13 in early June to the mid-€15s by September. It moved above €16 in November and ended the year around €16.20-€16.40.
In early 2026, the advance extended. ENI rose from approximately €16.40 at the start of January to trade in the high-€17s and low-€18s by early February, reaching €18.33 on 12 February 2026. This compares with €14.03 recorded on 12 February 2025, illustrating the scale of the move over a 12-month period. Past performance is not a reliable indicator of future results.
Past performance is not a reliable indicator of future results. Share prices are indicative and may differ from live market prices.
Eni (ENI): Capital.com analyst view
Eni’s share price has trended higher over the past two years, moving from the low-€13 area in early 2025 to around €18.33 as of 12 February 2026. Firmer cash generation, an active buyback programme and a supportive backdrop for energy equities have formed part of the fundamental context.
However, exposure to oil and gas prices, project execution and global growth dynamics means that changes in any of these areas could influence future performance. Commodity-price weakness, operational challenges or shifts in investor risk appetite could increase volatility and place pressure on valuations.
Market participants often monitor a combination of company-specific and macroeconomic factors, including dividend and share-repurchase plans, progress in lower-carbon initiatives and broader trends across European and global equity markets. At the same time, these drivers may evolve. If commodity prices soften, regulatory conditions tighten or capital flows shift, previous gains may not be sustained. This analysis is for informational purposes only and does not constitute investment advice.
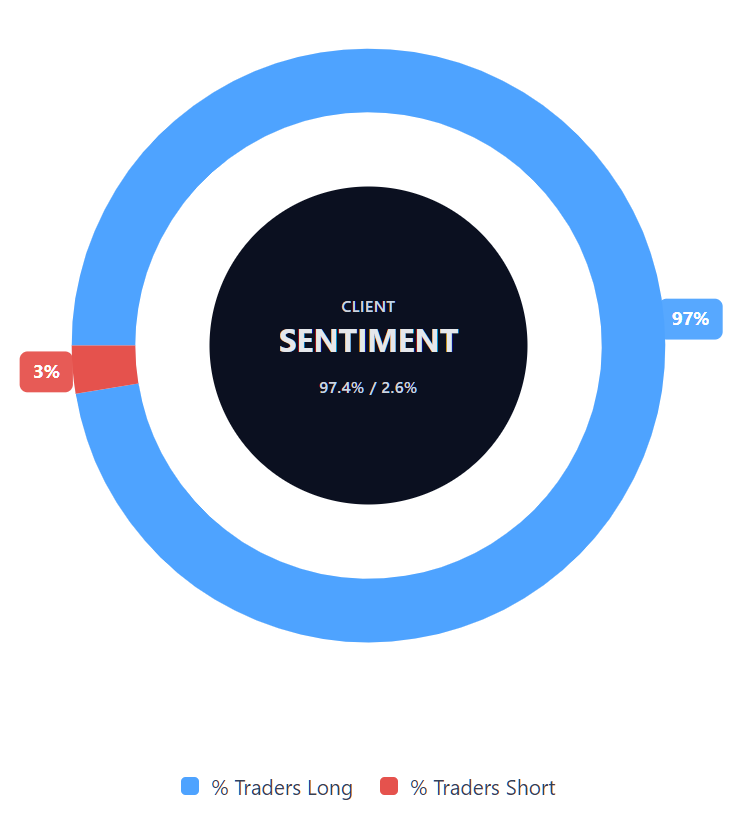
Capital.com’s client sentiment for Eni CFDs
As of 12 February 2026, Capital.com client positioning in Eni CFDs shows 97.4% of accounts holding buy positions versus 2.6% holding sell positions, leaving a net long skew of around 94.9 percentage points. This distribution reflects open CFD positions on the platform at the time of writing and can change as market conditions and client strategies evolve.
Summary – Eni 2026
- In 2025, Eni’s share price traded largely between €13 and €16, rising from the low-€13 area in January to close the year in the mid-€16s.
- Over the past two years, the stock has moved from approximately €14.03 on 12 February 2025 to €18.33 on 12 February 2026, marking a sustained advance with intermittent pullbacks.
- Current technical indicators show ENI trading above its key moving averages, while a relatively high RSI reading points to strong recent momentum alongside the possibility of sharper short-term corrections if conditions change.
Past performance is not a reliable indicator of future results.
FAQ
Who owns the most Eni stock?
What is the 5-year Eni share price forecast?
Is Eni a good stock to buy?
Whether Eni is considered ‘good’ depends on an individual’s objectives, risk tolerance and time horizon. The company operates in the integrated oil and gas sector, which can provide exposure to commodity-price movements and dividend income, but also carries volatility linked to energy markets and geopolitical developments. Share prices may respond to changes in earnings, capital allocation decisions and broader equity-market sentiment. This information is for general awareness only and does not constitute investment advice.
Could Eni stock go up or down?
Eni’s share price can move in either direction, at times significantly, depending on factors such as oil and gas prices, macroeconomic conditions, company performance and investor positioning. Technical indicators may highlight momentum or potential support and resistance levels, but they do not guarantee outcomes. As with all shares, past performance is not a reliable indicator of future results, and both advances and drawdowns can occur over short and long time horizons.
Should I invest in Eni stock?
Can I trade Eni CFDs on Capital.com?
Yes, you can trade Eni CFDs on Capital.com. Trading share CFDs lets you speculate on price movements without owning the underlying asset and to take long or short positions. However, contracts for difference (CFDs) are traded on margin, and leverage amplifies both profits and losses. You should ensure you understand how CFD trading works, assess your risk tolerance, and recognise that losses can occur quickly.