BP p.l.c. stock forecast: Brent surge and buyback pause
BP is an oil and gas company whose shares rose in March 2026 as Brent crude climbed above $116/bbl, while investors also assessed its suspended buybacks and higher cost-cutting target. Past performance is not a reliable indicator of future results. Explore third-party BP price targets.
BP p.l.c. (BP) is trading at £5.709 in early European trading, near the top of its intraday range of £5.465–£5.723 as of 10:24am UTC on 19 March 2026. Past performance is not a reliable indicator of future results.
The gains are driven primarily by surging Brent crude prices, which touched $116.55/bbl on 19 March 2026 – more than 52% above levels seen a month earlier – amid escalating conflict in the Middle East (Anadolu Agency, 19 March 2026). Strikes on Iran's South Pars gas field and energy infrastructure across the Gulf have disrupted supply routes and raised concerns over Strait of Hormuz tanker flows (The New York Times, 18 March 2026).
BP's corporate backdrop also includes increased scrutiny of its balance sheet restructuring. In February 2026, the company suspended share buybacks and raised its cost-cutting target to $5.5 billion–$6.5 billion by end-2027, while maintaining a dividend of 8.3 cents per ordinary share (Reuters, 10 February 2026). The broader FTSE 100 closed at 10,305 on 18 March 2026 (Trading Economics, 18 March 2026), with BP and Shell among the few laggards in that session as crude eased briefly before resuming its uptrend (Trading Economics, 19 March 2026).
BP p.l.c. stock forecast 2026–2030: Third-party price targets
As of 19 March 2026, third-party BP p.l.c. stock predictions reflect a widening divergence between cautious multi-broker consensus levels and individual upgrades tied to surging Brent crude prices. The following briefs summarise dated assessments published within that window.
MarketBeat (broker consensus snapshot)
MarketBeat's aggregated consensus across 23 brokerages rated BP ‘hold’, with an average 12-month price target of $37.35 per ADR share, drawn from two strong buy, six buy, nine hold, and six sell ratings. The consensus target sat below BP's then-prevailing ADR price of around $42.32, reflecting lingering analyst caution around the company's suspended share buyback programme and strategic reset (MarketBeat, 11 March 2026).
Piper Sandler (individual target revision)
Piper Sandler analyst Ryan Todd raised the firm's 12-month price target on BP to $47 per ADR from $44, retaining a neutral rating. That implied roughly 11% upside from BP's price at the time of publication. Todd's revision followed BP's Q4 2025 earnings beat, in which the company reported EPS of $10 against a $0.57 consensus estimate and revenue of $47.38 billion against a $42.19 billion forecast (MarketBeat, 12 March 2026).
Wall Street Zen (rating upgrade)
Wall Street Zen upgraded BP (NYSE: BP) from hold to buy, citing higher oil prices driven by Middle East supply concerns as a near-term tailwind for BP's upstream margins and cash flow. The firm also noted key downside risks, including a disputed gas arrangement in Senegal and possible labour action at BP's Whiting refinery (MarketBeat, 14 March 2026).
Barclays (individual target revision)
Barclays analyst Lydia Rainforth raised the firm's price target on BP to 650p from 590p, retaining an overweight rating and indicating a roughly 19% premium to BP's London-listed share price at the time of the note. Rainforth's rationale focused on Brent crude's move above $100/bbl since early 2026 and BP's production cost base of around $40/bbl, which she said could support materially higher margins (Motley Fool, 17 March 2026).
Predictions and third-party forecasts are inherently uncertain, as they cannot fully account for unexpected market developments. Past performance is not a reliable indicator of future results.
BP stock price: Technical overview
The BP stock price trades at £5.709 in early European trade at 10:24am UTC on 19 March 2026, near the top of its intraday range of £5.465–£5.723. Every moving average on the daily chart signals buy, with the 20/50/100/200-day SMAs stacked at roughly £5.05 / £4.75 / £4.60 / £4.35, and with a 20-over-50 alignment intact across both the simple and exponential families.
Momentum is stretched: the 14-day RSI stands at 79.4, firmly in overbought territory and above the threshold that has historically preceded consolidation or pullbacks. The ADX at 37.5 confirms an established trend, with directional pressure still clearly to the upside as of the current session.
To the topside, the nearest classic resistance reference is the R1 pivot at £4.94, already cleared by the prevailing price. The R2 level at £5.11 is likewise in the rear-view, leaving R3 near £5.54 as the next significant classic pivot reference. A sustained daily close above £5.54 would reopen the path towards the intraday high of £5.723 and the broader £5.70–£5.75 area as the next zone to monitor.
On pullbacks, the classic pivot (P) at £4.68 represents the first meaningful reference below the current price, followed by the 100-day SMA shelf near £4.60. Losing that shelf on a daily closing basis would increase the risk of a deeper retracement towards S1 at £4.51 and, beyond that, the 200-day SMA near £4.35 (TradingView, 19 March 2026).
This is technical analysis for informational purposes only and does not constitute financial advice or a recommendation to buy or sell any instrument.
BP p.l.c. share price history (2024–2026)
BP’s stock price closed at £4.955 on 20 March 2024, trading comfortably above £5 through much of spring 2024 before reaching a two-year high of £5.399 on 12 April 2024.
The stock then entered a prolonged slide, falling through the second half of 2024 amid weaker crude prices and investor concerns over BP's strategic direction. BP ended 2024 at £3.925, and in early 2025 the pressure continued – shares touched a two-year low of £3.317 in April 2025, during a volatile stretch that coincided with BP's suspension of its share buyback programme and a deepened cost-cutting target announced in February 2025.
Recovery came gradually through mid-2025, with BP closing the year at £4.330 – a gain of around 10.3% over 2024 as a whole. The more dramatic move came in 2026: BP opened the year at £4.393 on 2 January and surged through March as Brent crude climbed sharply above $100/bbl amid escalating Middle East tensions.
BP closed at £5.722 on 19 March 2026, which is approximately 30.3% up year to date and 29.5% up year on year.
Past performance is not a reliable indicator of future results. Share prices are indicative and may differ from live market prices.
BP p.l.c. (BP): Capital.com analyst view
BP's price performance so far in 2026 has been notably sharp, with shares rallying more than 30% year to date as of 19 March 2026, driven largely by Brent crude's climb above $100/bbl amid supply disruptions tied to Middle East conflict. The company's revised strategy, which refocuses capital on hydrocarbon production over energy transition investments, has also attracted renewed interest from investors who view BP's low production cost base as a potential margin tailwind in a higher oil price environment. That said, the same crude-driven rally that has lifted shares could reverse quickly. A de-escalation in geopolitical tensions, a demand slowdown, or an OPEC output increase could weigh on oil prices and, in turn, BP's earnings outlook.
At the company level, BP's suspension of share buybacks and its elevated cost-cutting targets reflect ongoing pressure on the balance sheet that some analysts continue to flag as a concern. The stock's recent run has carried momentum indicators into stretched territory, which may prompt periods of consolidation or profit-taking. Investors may also weigh BP's ongoing strategic transition and any changes to its dividend policy against the backdrop of a volatile commodity cycle.
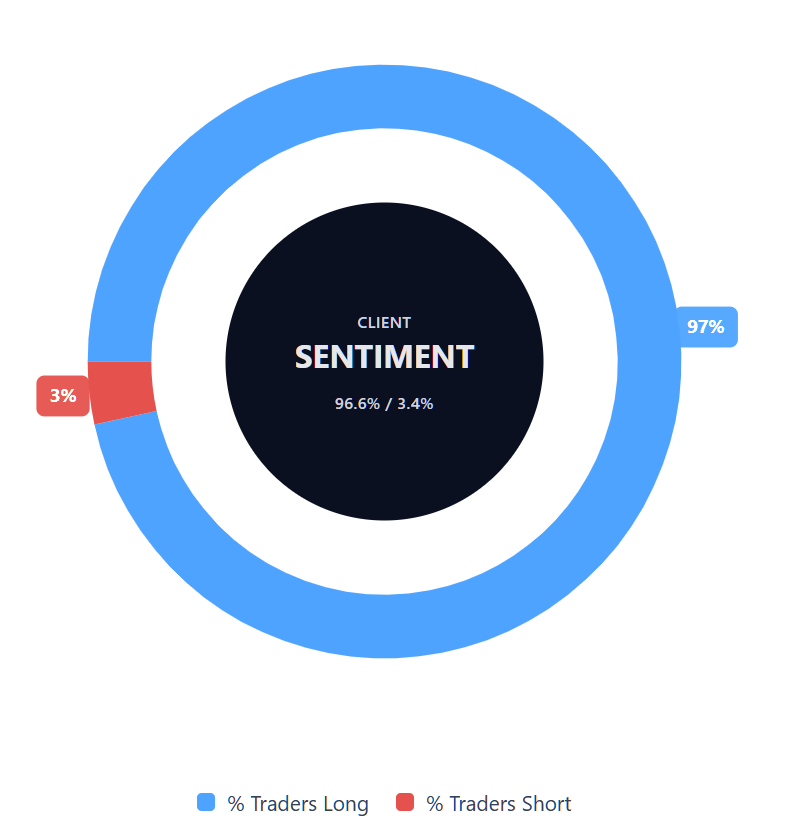
Capital.com’s client sentiment for BP p.l.c. CFDs
As of 19 March 2026, Capital.com client positioning in BP p.l.c. CFDs stands at 96.6% buyers vs 3.4% sellers, putting buyers ahead by 93.2 percentage points and placing sentiment firmly in one-sided long territory. This snapshot reflects open positions on Capital.com at the time of writing and can change.
Summary – BP p.l.c. 2026
- BP (BP) trades at £5.709 as of 10:24am UTC on 19 March 2026, up 30.3% year to date and 29.5% year on year.
- Classic pivot support sits at £4.68, with the 100-day SMA near £4.60 as the key shelf. R3 at £5.54 has been cleared, leaving the intraday high of £5.723 as the next reference.
- The primary driver is Brent crude's surge above $100/bbl, with Brent touching $116.55 on 19 March 2026 amid US-Iran conflict and supply disruption fears in the Gulf.
- BP suspended share buybacks in February 2026 and raised its cost-cutting target to $5.5bn–$6.5bn by end-2027, reflecting balance sheet pressure despite a Q4 2025 earnings beat.
Past performance is not a reliable indicator of future results.
FAQ
Who owns the most BP p.l.c. stock?
What is the 5 year BP p.l.c. share price forecast?
Is BP p.l.c. a good stock to buy?
Whether BP is a good stock to buy depends on an investor’s objectives, time horizon and tolerance for risk. In the article, support for the share price comes mainly from stronger crude prices, while the main risks include commodity volatility, balance sheet pressure and uncertainty around the company’s strategy. That means the stock may appeal to some market participants, but it may not suit others. This is a personal decision, not a universal conclusion.
Could BP p.l.c. stock go up or down?
Should I invest in BP p.l.c. stock?
Can I trade BP CFDs on Capital.com?
Yes, you can trade BP p.l.c. CFDs on Capital.com. Trading share CFDs lets you speculate on price movements without owning the underlying asset and to take long or short positions. However, contracts for difference (CFDs) are traded on margin, and leverage amplifies both profits and losses. You should ensure you understand how CFD trading works, assess your risk tolerance, and recognise that losses can occur quickly.