BASF stock forecast: Zhanjiang ramp-up, Care Chemicals price rise
BASF is a DAX-listed chemicals group whose recent trading has been shaped by the ramp-up of its Zhanjiang Verbund site in China and higher Care Chemicals prices in Europe. Past performance is not a reliable indicator of future results. Explore third-party BAS price targets and technical analysis.
BASF SE (BAS) is trading at €49.85 in afternoon European trading at 12:03pm UTC on 25 March 2026, having recovered sharply from the session low of €47.37. Past performance is not a reliable indicator of future results.
The rebound coincides with a broader DAX recovery, with the index trading around 22,978 after closing at 22,636 on 24 March 2026, as easing geopolitical tensions in the Middle East lifted sentiment across European equities. Bloomberg reported on 22 March 2026 that stocks rose and oil fell after President Trump softened his tone on Iran, reducing a key risk premium that had weighed on European industrials (Bloomberg, 22 March 2026).
Company-specific momentum has also contributed, as BASF's Zhanjiang Verbund site in South China continues to ramp up operations, with BASF's CEO stating in early March that the €8.7 billion facility is expected to begin generating profits next year and that China's share of group sales could rise from approximately 13% to between 15%–20% (Xinhua, 4 March 2026). Separately, BASF announced a price increase of up to 30% on certain Care Chemicals products in Europe, citing higher materials and energy costs (Reuters, 18 March 2026).
BASF stock forecast 2026–2030: Third-party price targets
As of 25 March 2026, third-party BASF stock predictions reflect diverging assessments of the chemicals cycle recovery, BASF's ongoing restructuring delivery, and Middle East geopolitical risk.
J.P. Morgan (underweight, bear case)
J.P. Morgan analyst Chetan Udeshi reiterates an Underweight rating and a €36 price target, the lowest published target among active covering brokers. Udeshi argues that the share price has become disconnected from underlying fundamentals, as BASF's 2026 EBITDA guidance range of €6.2 billion–€7.0 billion does not provide evidence of an imminent earnings recovery amid continued weakness in core chemicals demand (The Globe and Mail, 5 March 2026).
BASF Investor Relations (company consensus snapshot)
BASF's investor relations page records a mean consensus price target of €49.52 across covering analysts, with a high estimate of €62 and a low of €36. The wide spread reflects diverging assumptions on the timing of a chemicals-cycle upturn and the delivery of BASF's targeted €2.3 billion in annual cost savings (BASF Investor Relations, 12 March 2026).
Simply Wall St (valuation assessment)
Simply Wall St assesses BASF as trading near fair value, with the share price at €46 at the time of writing and seven-day and 30-day returns of 4.9% down and 7.8% down respectively, suggesting recent momentum had cooled. The note flags that earnings are forecast to grow by 11.7% per annum, while the current multiple sits broadly in line with the assessed intrinsic value range (Simply Wall St, 21 March 2026).
Deutsche Bank Research (buy, upgraded target)
Deutsche Bank Research analyst Virginie Boucher-Ferte upgraded BASF to Buy from Hold and raised the BAS stock forecast to €55 from €45, citing a reshuffling of sector ratings in response to heightened uncertainty surrounding the Middle East conflict. Boucher-Ferte notes that while the consequences for the chemicals industry remain difficult to gauge, BASF is among the names she expects to be a net beneficiary of protracted post-conflict dynamics (MarketScreener, 24 March 2026).
MarketBeat (broker consensus)
MarketBeat aggregates covering analyst ratings and records a consensus recommendation of Hold for BASF, with the OTC-listed ADR (BASFY) opening at $14.13 and a one-year range of $10.75–$15.60 reflecting the breadth of underlying share price movement. The Hold consensus reflects a balance between bearish valuation concerns at the lower end and buy-rated brokers positioned for a longer-dated earnings recovery (MarketBeat, 25 March 2026).
Predictions and third-party forecasts are inherently uncertain, as they cannot fully account for unexpected market developments. Past performance is not a reliable indicator of future results.
BAS stock price: Technical overview
On the daily chart, the BAS stock price trades at €49.85 as of 12:03pm UTC on 25 March 2026, holding above a tightly stacked moving-average cluster where the 20/50/100/200-day SMAs sit at approximately €47 / €48 / €46 / €45, with the 20-over-50 alignment intact across both the simple and exponential families, according to TradingView data. The Hull moving average (9) at €47.98 and the volume-weighted moving average (20) at €47.06 add to the layer of near-term support beneath the current price. The Ichimoku base line at €47.19 sits within that same band, registering neutral on TradingView's scale.
Momentum is upper-neutral to firm: the 14-day relative strength index reads 59.66, a level TradingView classifies as neutral and consistent with positive but not stretched momentum. The average directional index (14) at 17.13 sits in the 15–25 zone, suggesting the prevailing move carries some directional conviction without yet qualifying as a strongly trending market.
To the topside, the classic R1 pivot at €52.37 is the nearest reference above the last price; a daily close through that level would put the R2 area near €56.05 in view. The Fibonacci R1 at €51.70 and the Camarilla R2 at €49.99 sit closer to current levels and represent near-term reference points within the intraday range already reached today (high: €49.99).
On pullbacks, the classic pivot point (P) at €49.01 marks initial support, sitting just below the last price. The 100-day SMA near €45.76 and the 200-day SMA near €44.69 represent the broader moving-average shelf; a sustained move back below the pivot and through the 20-day SMA cluster near €47 would bring the S1 level at €45.33 into closer proximity with that longer-term support band. All pivot and moving-average data are sourced from TradingView as of 25 March 2026 (TradingView, 25 March 2026).
This is technical analysis for informational purposes only and does not constitute financial advice or a recommendation to buy or sell any instrument.
BASF share price history (2024–2026)
BASF SE (BAS) trades on the Frankfurt Stock Exchange (Xetra) in euros and is a constituent of Germany's DAX index.
BAS’s stock price opened the two-year window around €52.81 in late March 2024 before reaching a local high of €54.88 on 4 April 2024, its peak within the dataset. The stock then drifted lower through summer 2024, touching €40.79 on 5 August 2024—its two-year intraday low—amid a broader European equities sell-off and persistent softness in chemicals demand. A partial recovery followed into autumn 2024, with BAS clawing back to around €48.45 by early October 2024 before retreating again to close the year at €42.58 on 30 December 2024.
2025 brought a sharp early rebound, with BAS surging to €53.40 on 18 March 2025—its highest close in the dataset. That strength proved short-lived; the stock reversed hard in April, dropping to €40.80 on 7 April 2025 amid a broad market sell-off linked to escalating US tariff concerns. BAS spent much of the second half of 2025 recovering gradually, closing the year at €44.61 on 30 December 2025.
BAS closed at €50.20 on 25 March 2025, compared with a last price of €49.85 on 25 March 2026, broadly flat year on year at approximately 0.7% lower. Year to date, from the 2 January 2026 close of €44.84, the stock is up approximately 11.2%.
Past performance is not a reliable indicator of future results. Share prices are indicative and may differ from live market prices.
BASF (BAS): Capital.com analyst view
BASF's share price has traced a broadly range-bound path over the past two years, oscillating between a dataset low near €40.79 and a high of €54.88, with the stock currently trading around the mid-point of that range at €49.85 as of 25 March 2026. The group's Zhanjiang Verbund site in China represents a long-dated growth lever, with management citing the potential for China's share of group sales to rise from approximately 13% to 15%–20% over time; however, that same China exposure carries execution risk, as softer-than-expected domestic chemicals demand or renewed trade friction could weigh on returns before the site reaches profitability. Deutsche Bank's fresh upgrade to Buy with a €55 target on 24 March 2026 reflects optimism around a chemicals-cycle recovery, while J.P. Morgan's unchanged €36 Underweight rating signals that not all analysts are convinced an earnings inflection is imminent.
On the macro side, easing Middle East tensions and a partial DAX recovery provide a constructive near-term backdrop for European industrials. However, the same geopolitical uncertainty that briefly lifted sentiment could reverse quickly, renewing pressure on energy-intensive producers like BASF. The group's announced price increases of up to 30% on certain product lines may support margins if demand holds, but they also carry volume risk if customers push back in a still-subdued chemical end market.
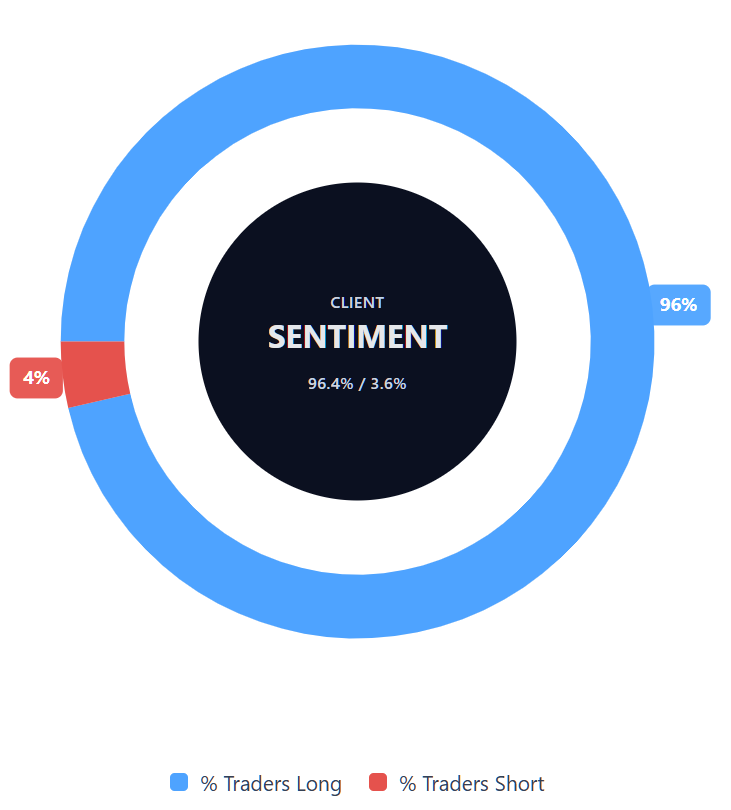
Capital.com’s client sentiment for BASF CFDs
As of 25 March 2026, Capital.com client positioning in BASF CFDs is skewed toward the long side: 96.4% buyers vs 3.6% sellers, putting buyers ahead by 92.8 percentage points and placing sentiment firmly in a heavy-buy, one-sided-towards-longs positioning pattern. This snapshot reflects open positions on Capital.com and can change rapidly as market conditions evolve.
Summary – BASF 2026
- BAS trades at €49.85 as of 12:03pm UTC on 25 March 2026, up approximately 11.2% year to date from the 2 January 2026 close of €44.84.
- Over the past two years, BAS has ranged between a low of €40.79 (August 2024) and a high of €54.88 (April 2024), currently sitting near the mid-point of that range.
- TradingView data shows all major moving averages aligned in buy territory, with the 14-day RSI at 59.66—upper-neutral—and the ADX at 17.13 suggesting moderate rather than strongly established trend momentum.
- Key price drivers include the Zhanjiang Verbund site ramp-up in China, BASF's ongoing restructuring targeting €2.3bn in annual savings, and a price increase of up to 30% on select Care Chemicals lines in Europe.
- The broader macro context includes a partial DAX recovery following easing Middle East tensions, with European industrials benefiting from improved risk sentiment on 25 March 2026.
Past performance is not a reliable indicator of future results.
FAQ
Who owns the most BASF stock?
What is the 5 year BASF share price forecast?
Is BASF a good stock to buy?
Could BASF stock go up or down?
Should I invest in BASF stock?
Can I trade BASF CFDs on Capital.com?
Yes, you can trade BASF CFDs on Capital.com. Trading share CFDs lets you speculate on price movements without owning the underlying asset and to take long or short positions. However, contracts for difference (CFDs) are traded on margin, and leverage amplifies both profits and losses. You should ensure you understand how CFD trading works, assess your risk tolerance, and recognise that losses can occur quickly.