Apple stock forecast: Third-party price targets
Apple Inc is a US-based technology company listed on the Nasdaq under the ticker AAPL, generating revenue from hardware products such as the iPhone and Mac, alongside a growing global services business. Explore third-party AAPL price targets and technical analysis.
Apple Inc (AAPL) is trading around $265.32 in late US hours on 18 February 2026, moving within an intraday range of $254.56–$266.10 on Capital.com’s feed as of 5:02pm UTC. Past performance is not a reliable indicator of future results.
The stock is trading in the wake of Apple’s fiscal first-quarter 2026 results. The company reported revenue of $143.8bn, up 16% year on year, and diluted earnings per share of $2.84, up 19% from a year earlier (Apple Newsroom, 29 January 2026). At the same time, broader US tech sentiment remains tied to the Nasdaq Composite, which has eased roughly 2.1% over the past week (Nasdaq, 17 February 2026). Apple has also scheduled its 2026 virtual annual shareholders’ meeting for 24 February 2026 at 8am Pacific time, keeping corporate governance events in focus alongside earnings (MacRumors, 8 January 2026).
Apple stock forecast 2026–2030: Third-party price targets
As of 18 February 2026, third-party Apple stock predictions broadly link their assumptions to artificial intelligence (AI) product cycles, iPhone demand and services trends. The following summaries outline six recent third-party views, their stated targets and the context each provider cites. These reflect external opinions and not a recommendation.
24/7 Wall St. (consensus snapshot)
24/7 Wall St. cites an average Wall Street AAPL stock forecast of about $292.15, based on a survey of 47 analysts. The article notes that this implied roughly 10% upside to the price at the time. It attributes the range of targets to differing views on cost pressures, AI-related delays and whether the latest share-price pullback had fully reflected those risks (24/7 Wall St., 16 February 2026).
Goldman Sachs (investment bank note)
Goldman Sachs reiterates its Buy rating on Apple with a 12-month price target of $330. The bank cites improved App Store spending trends and outlined a constructive multi-year view on iPhone and services growth. At the same time, it notes that the stock was trading near its 52-week high and appeared elevated relative to some fair-value estimates (Investing.com, 3 February 2026).
Evercore ISI (broker research)
Evercore analyst Amit Daryanani reaffirms a Buy rating on Apple and sets a price target of $330. The firm highlights Apple’s ecosystem, potential contributions from AI-enabled devices and services, and the company’s ability to sustain growth despite macroeconomic and regulatory headwinds (CNBC, 8 February 2026).
Wedbush (broker research)
Wedbush client note maintains its Apple price target at $350 after first raising it in December 2025. The firm points to expectations for ‘Apple Intelligence’ to support a new AI-driven upgrade cycle, alongside a potential recovery in China and the development of subscription-based AI features. The note also acknowledges concerns that Apple’s AI rollout may progress more gradually than some competitors’ (AppleInsider, 17 February 2026).
Oppenheimer (broker update)
Oppenheimer analyst Samik Chatterjee increases his Apple price target to $340 from $325. The article indicates that the revision reflects a reassessment of Apple’s earnings profile and AI-related opportunities, while also recognising valuation considerations and competitive pressures within large-cap technology (Yahoo Finance, 12 February 2026).
Predictions and third-party forecasts are inherently uncertain, as they cannot fully account for unexpected market developments. Past performance is not a reliable indicator of future results.
AAPL stock price: Technical overview
The AAPL stock price is trading around $265.32 as of 5:02pm UTC on 18 February 2026, holding close to the classic pivot at $260.25. The 20-, 50- and 100-day simple moving averages (SMAs) cluster near $263.65, $266.77 and $265.96 respectively, while the 200-day SMA sits lower at $240.58. The 20-day average is broadly aligned with the 50- and 100-day measures rather than forming a clear short-term crossover. The 200-day average continues to track below price, indicating that the broader upward structure from earlier levels remains intact.
The 14-day relative strength index (RSI) is near 50, suggesting neutral momentum. The average directional index (ADX), at around 20.9, indicates that a trend is present but not especially strong.
On the upside, the first reference above the current price is the classic R1 pivot at $277.07. A sustained move beyond that level would bring $294.67 (R2) into focus. On pullbacks, the $260.25 classic pivot may act as initial support. Below that, attention may turn to the 100-day SMA near $265.96 and then to $242.65 (S1) if selling pressure increases (TradingView, 18 February 2026).
This technical analysis is for informational purposes only and does not constitute financial advice.
Apple share price history (2024–2026)
AAPL’s stock price has risen over the past two years from the high-$100s and low-$200s into the mid-$200s. The stock traded near $181 in late February 2024, dipped below $200 in June, and then advanced through the $220–$240 range in the second half of 2024, ending the year around $250.
During 2025 and into early 2026, AAPL extended that move. It traded above $200 in April 2025 and later moved within the $230–$270 range, with rallies in April and August followed by periods of consolidation. By 18 February 2026, Apple closed at $265.37. That places it around 8.3% above its $245 close on 18 February 2025 and approximately 37.8% higher than its late-February 2024 level near $192.41. As with all historical data, past performance is not a reliable indicator of future results.
Past performance is not a reliable indicator of future results. Share prices are indicative and may differ from live market prices.
Apple (AAPL): Capital.com analyst view
Apple’s share price has moved into the mid-$200s, with trading around $265 as of 18 February 2026. The market has weighed record financial results against shifts in sentiment towards large-cap US technology stocks and the interest-rate environment.
The company’s fiscal first-quarter 2026 results showed revenue of $143.8bn and diluted earnings per share of $2.84, with iPhone and services segments contributing to growth. Some market participants interpret this as evidence of operational resilience. Others question whether current valuations leave limited room for earnings disappointment, particularly in a competitive and evolving technology landscape.
Discussion around Apple’s AI roadmap remains central to many research notes. Some analysts describe 2026 as an important period for AI-enabled product features and potential upgrade cycles. A more cautious perspective highlights the possibility that slower adoption, execution challenges or regulatory developments could affect expectations. As a result, future price performance may depend on how effectively Apple balances product innovation, demand trends and cost management.
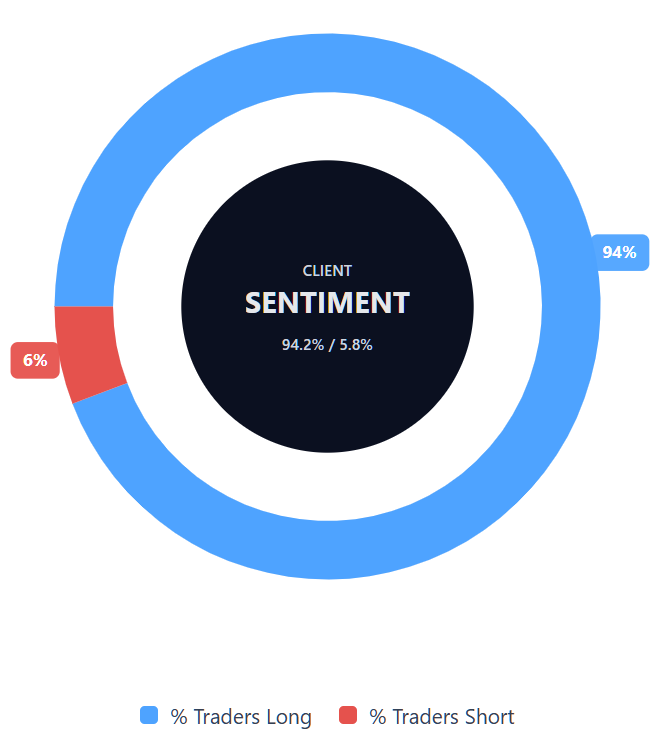
Capital.com’s client sentiment for Apple CFDs
As of 18 February 2026, Capital.com client positioning in Apple CFDs shows 94.2% buyers versus 5.8% sellers – a one-sided profile favouring long positions, with buyers ahead by 88.4 percentage points. This distribution indicates that positioning is concentrated on the long side rather than evenly balanced. This data reflects open positions on Capital.com at the time of writing and can change.
Summary – Apple 2026
- Apple’s share price has trended higher over the past two years, moving from the high-$100s and low-$200s into the mid-$200s by February 2026.
- Technical indicators place the 14-day RSI near 50 and the ADX around 20.9, suggesting neutral momentum and a trend that lacks strong directional conviction.
- Apple’s recent price action has followed record first-quarter 2026 results and continued debate over its AI strategy, which analysts assess both as a potential growth driver and as a source of execution and valuation risk.
- Key factors influencing the stock in early 2026 include iPhone and services performance, broader large-cap technology sentiment, macroeconomic conditions and evolving expectations for Apple’s AI-related hardware and software developments.
Past performance is not a reliable indicator of future results.
FAQ
Who owns the most Apple stock?
What is the 5 year Apple share price forecast?
Is Apple a good stock to buy?
Could Apple stock go up or down?
Apple’s share price can move in either direction. It may rise if earnings growth, product launches or market sentiment exceed expectations. It may fall if results disappoint, costs increase, regulation tightens or broader equity markets weaken. Technical indicators, such as RSI or moving averages, can highlight momentum and trend conditions, but they do not predict outcomes. Like all listed shares, Apple is exposed to volatility and external risk factors.
Should I invest in Apple stock?
Can I trade Apple CFDs on Capital.com?
Yes, you can trade Apple CFDs on Capital.com. Trading share CFDs lets you speculate on price movements without owning the underlying asset and to take long or short positions. However, contracts for difference (CFDs) are traded on margin, and leverage amplifies both profits and losses. You should ensure you understand how CFD trading works, assess your risk tolerance, and recognise that losses can occur quickly.