Alphabet stock forecast: Q4 results & US antitrust appeals
Alphabet is a US-listed technology company whose shares are trading around its Q4 2025 results, reporting $113.8bn in revenue, as ongoing US antitrust appeals continue to shape the outlook. Explore third-party GOOG price targets and technical analysis.
Alphabet Inc (GOOG) is trading around $308.36 in Friday’s US session, moving within an intraday range of $303.74–$314.10 on Capital.com’s feed as of 3:39pm UTC on 27 February 2026. The price sits in the upper half of the day’s quoted range, suggesting moderate intraday volatility but no clear breakout beyond recent session extremes. Past performance is not a reliable indicator of future results.
The stock is reacting to Alphabet’s recently reported fourth-quarter 2025 results, where revenue reached about $113.8bn and net income rose to roughly $34.5bn, with diluted earnings per share (EPS) of $2.82 (Nasdaq, 4 February 2026). Trading also continues against the backdrop of ongoing US antitrust proceedings, as the Department of Justice and several states have filed notices to appeal remedies in the Google search monopoly case, prolonging legal uncertainty around the group’s search and advertising business (Bloomberg, 3 February 2026).
Alphabet stock forecast 2026–2030: Third-party price targets
As of 27 February 2026, third-party Alphabet stock predictions reflect a broad range of perspectives, with several brokers updating 12-month targets following the latest earnings release and AI investment guidance. These views reflect external opinions and do not constitute investment advice.
Scotiabank (target revision)
Scotiabank raises its price target on Alphabet to $400 from $375 in February 2026 and retains an Outperform rating. The report cites strong post-results trading and cloud and AI-related momentum, while noting that elevated investment levels and competition from newer AI products remain key variables (Intellectia, 18 February 2026).
Raymond James (rating upgrade)
Raymond James upgrades Alphabet to Strong Buy and, as of 18 February 2026, lifts its 12-month price target from $315 to $400. The firm says the revision reflects increased confidence in Google Cloud Platform and AI-related operations, with above-consensus cloud growth expectations offset by execution and regulatory risks that it continues to assess (Intellectia, 18 February 2026).
UBS (broker update)
UBS keeps a Neutral rating on Alphabet and sets a 12-month price target of $348 for the shares. The broker states that its stance reflects solid advertising and cloud trends, while increased capital expenditure for AI and data-centre build-out tempers potential upside at this stage (FinancialModelingPrep, 5 February 2026).
TipRanks (analyst overview)
TipRanks reports that Wall Street analysts assign Alphabet Class C a Strong Buy consensus rating, with an average 12-month GOOG stock forecast of about $384.18. The article states that this aggregate figure draws on multiple broker estimates and sits within a broader range of individual targets. While many analysts point to earnings trends, AI initiatives and cloud expansion as supportive factors, they also reference regulatory and spending risks (The Globe and Mail, 7 February 2026).
Bank of America (broker stance)
Bank of America maintains a Buy rating on Alphabet Class C and references a 12-month price target around $384.18, broadly in line with prevailing Street estimates. As reported, the broker ties its view to expectations for continued performance in core search and YouTube, alongside AI- and cloud-related growth drivers, while continuing to monitor regulatory and competitive developments (The Globe and Mail, 10 February 2026).
Predictions and third-party forecasts are inherently uncertain, as they cannot fully account for unexpected market developments. Past performance is not a reliable indicator of future results.
GOOG stock price: Technical overview
The GOOG stock price trades near $308.36 as of 3:39pm UTC on 27 February 2026, sitting below its short- and medium-term moving average cluster, with the 20-, 50-, 100- and 200-day simple moving averages (SMAs) grouped around 318, 320, 302 and 250 respectively. The 14-day relative strength index (RSI) near 40.9 places momentum in lower-neutral territory, while an average directional index (ADX) reading around 30 suggests an established trend backdrop rather than range-bound conditions.
On the topside, the nearest classic resistance appears at R1 near 350, with R2 around 362 only coming into focus if price records a sustained daily close above the first pivot area. On the downside, the classic pivot near 330 acts as an initial reference point. The 100-day SMA around 302 forms the first notable moving-average shelf below the current price, while the 200-day SMA near 250 marks a deeper technical level on the broader chart. A decisive move below the 100-day average could expose the recent S1 region around 299, whereas a recovery above the pivot would be required to ease near-term pressure on the moving-average cluster (TradingView, 27 February 2026).
This technical analysis is provided for informational purposes only and does not constitute financial advice or a recommendation to buy or sell any instrument.
Alphabet share price history (2024–2026)
GOOG’s stock price spent much of 2024 trending higher from the mid-$130s, with GOOG closing at $139.88 on 29 February 2024 before moving into the $170–$190 zone by year-end, as large-cap technology and AI-linked names outperformed. Momentum accelerated through 2025. The stock traded around the mid-$160s in April, broke above $200 by late summer and finished the year at $313.93 on 31 December 2025 following a strong second-half advance.
In 2026 so far, GOOG has held onto most of those late-2025 gains, trading largely between $300 and $350 amid post-earnings moves and broader market fluctuations. The share price closed at $315.36 on 2 January 2026 and last settled at $308.43 on 27 February 2026. This leaves it modestly lower month to date, but substantially higher than levels seen in early 2025. Past performance is not a reliable indicator of future returns.
Past performance is not a reliable indicator of future results.
Alphabet (GOOG): Capital.com analyst view
Alphabet’s Class C share price has moved significantly over the past two years, rising from the high-$100s in early 2024 to trade near $308 in late February 2026. This trajectory reflects investor responses to earnings delivery, cost management and the company’s focus on artificial intelligence and cloud computing, while also incorporating periods of volatility around quarterly updates and macroeconomic developments. Periods of consolidation and pullbacks illustrate that large-cap technology stocks can remain sensitive to shifts in interest rate expectations, regulatory developments and broader risk sentiment.
From a drivers perspective, stronger revenue growth, margin resilience and AI-related product expansion may support investor interest. Conversely, heavier capital expenditure, intensifying competition and tighter regulation could weigh on profitability and sentiment. Broader equity index performance and sector rotation trends may also influence price direction, underscoring that both upside and downside scenarios remain possible.
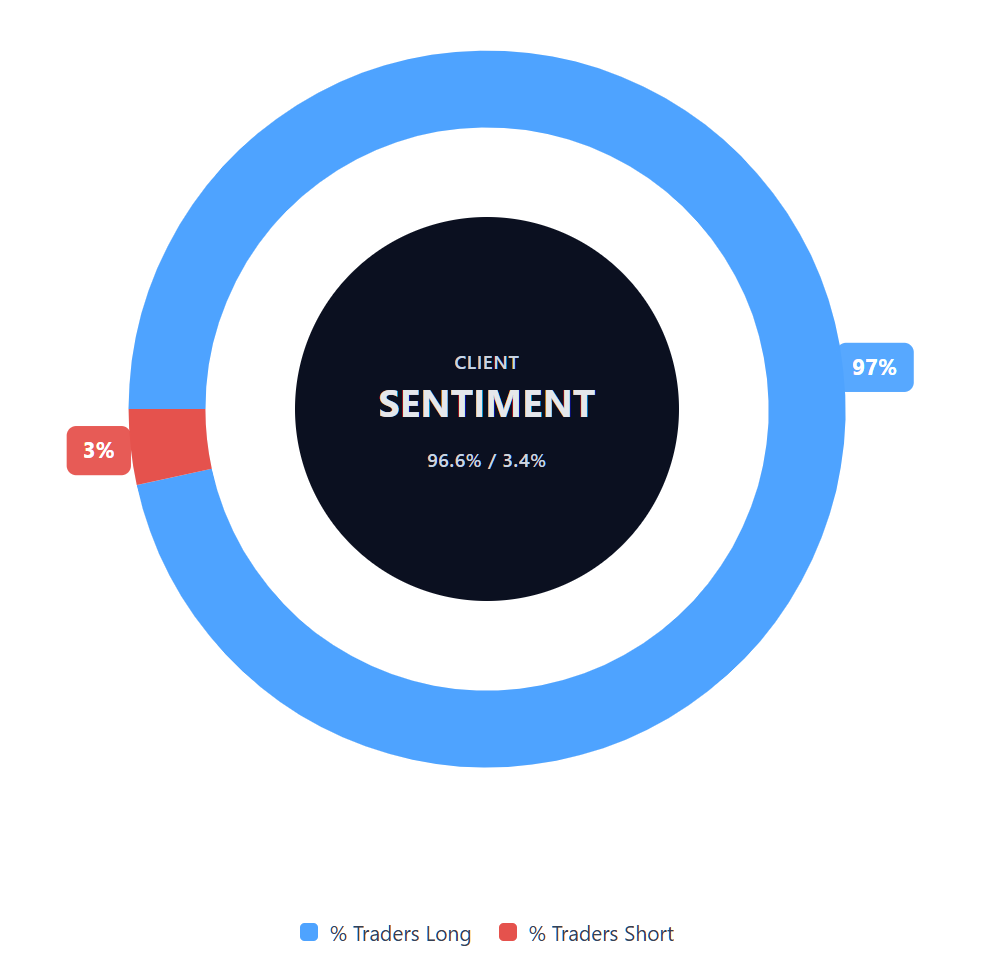
Capital.com’s client sentiment for Alphabet CFDs
As of 27 February 2026, Capital.com client positioning in Alphabet CFDs shows 96.6% buyers versus 3.5% sellers, creating a one-sided skew towards long positions, with buyers ahead by roughly 93 percentage points. This places positioning in heavy-buy territory, with a pronounced tilt towards long exposure rather than a balanced split. This snapshot reflects open positions on Capital.com at the time of writing and can change.
Summary – Alphabet 2026
- As of 3:39pm UTC on 27 February 2026, Alphabet (GOOG) trades near $308, up substantially from the high-$100s in early 2024 and mid-$100s in early 2025.
- Technical indicators show price trading below the 20-, 50-, 100- and 200-day moving averages, with RSI in lower-neutral territory and ADX pointing to an established trend environment.
- Key price drivers include Alphabet’s Q4 2025 results, with revenue around $113.8bn and EPS of $2.82, alongside performance in Search, YouTube and Cloud.
- Recent updates indicate that 2026 capital expenditure could approximately double, largely directed towards AI and data-centre infrastructure. While such investment may support longer-term growth initiatives, it could also place pressure on margins, depending on revenue outcomes and cost control.
Past performance is not a reliable indicator of future results.
FAQ
Who owns the most Alphabet stock?
Alphabet has a dual-class share structure, with Class A (GOOGL) and Class C (GOOG) shares listed publicly. Founders Larry Page and Sergey Brin remain among the largest individual shareholders, largely through their holdings of super-voting Class B shares, which are not publicly traded. Major institutional investors, such as asset managers and pension funds, also hold significant positions through index and actively managed funds. Ownership concentrations can shift over time as regulatory filings update and institutional allocations change.
What is the 5-year Alphabet share price forecast?
There is no fixed five-year GOOG stock forecast. Most publicly available analyst estimates focus on 12-month price targets rather than longer-term projections. Over a five-year horizon, outcomes could depend on factors such as revenue growth, cloud and AI development, capital expenditure levels, competitive pressures and regulatory developments. Macroeconomic conditions, interest rate trends and broader equity market cycles may also influence performance. Longer-term forecasts are inherently uncertain, and actual results may differ significantly from current expectations.
Is Alphabet a good stock to buy?
Whether Alphabet is considered a good stock to buy depends on an individual’s financial objectives, risk tolerance and investment horizon. The company operates in search, digital advertising and cloud computing, and continues to invest in artificial intelligence infrastructure and products. However, it also faces regulatory scrutiny, competitive dynamics and earnings sensitivity to higher operating and capital costs. Investors often weigh potential growth drivers against valuation levels and downside risks before making portfolio decisions. This information is for general educational purposes only and does not constitute investment advice.
Could Alphabet stock go up or down?
Alphabet’s share price can move in either direction, at times with elevated volatility. Upside scenarios may relate to stronger-than-expected earnings, sustained cloud expansion or more effective AI monetisation. Downside risks could stem from regulatory outcomes, margin pressure linked to rising capital expenditure, competitive developments or broader market weakness. As with any listed equity, price movements reflect changing expectations, investor positioning and macroeconomic conditions. Past performance is not a reliable indicator of future returns.
Should I invest in Alphabet stock?
Deciding whether to invest in Alphabet stock requires careful consideration of your personal financial circumstances and overall portfolio strategy. Shares can provide exposure to large-cap technology trends, but they also carry market-wide and company-specific risks. You should assess how such exposure aligns with your objectives and risk tolerance. This content is provided for general information only and does not constitute investment advice. You may wish to conduct independent research or seek professional guidance before making an investment decision.
Can I trade Alphabet CFDs on Capital.com?
Yes, you can trade Alphabet CFDs on Capital.com. Trading share CFDs lets you speculate on price movements without owning the underlying asset and to take long or short positions. However, contracts for difference (CFDs) are traded on margin, and leverage amplifies both profits and losses. You should ensure you understand how CFD trading works, assess your risk tolerance, and recognise that losses can occur quickly.