Microsoft stock forecast: Q2 revenue up 17%, Azure +39%
Microsoft is a US-listed technology company focused on cloud, enterprise software and AI, reporting 17% year-on-year revenue growth in fiscal Q2 2026, with Azure up 39% and Copilot seats at 15 million. Past performance is not a reliable indicator of future results.
Microsoft Corp. (MSFT) is trading around $401.28 in early US dealings on 26 February 2026, holding near the upper end of its intraday range between $387.96 and $402.01 on Capital.com’s feed as of 2:20pm UTC. The stock has been volatile since its late-January earnings release, with recent sessions showing swings around the $400 level amid broader moves in large-cap US technology shares. Past performance is not a reliable indicator of future results.
Price action follows Microsoft’s fiscal Q2 2026 results, which showed overall revenue growth of about 17% year-on-year to just over $81bn (Investing.com, 29 January 2026). Microsoft Cloud revenue surpassed $50bn, while Azure and other cloud services grew by close to 39% (Microsoft, 28 January 2026). Trading is also unfolding as investors assess corporate developments, including the expansion of AI-related products such as Microsoft 365 Copilot, where paid users have reached roughly 15 million (Computerworld, 29 January 2026).
Microsoft stock forecast 2026–2030: Third-party price targets
As of 26 February 2026, third-party Microsoft stock predictions cluster above the current Capital.com quote, with most surveyed brokers maintaining positive recommendations. The following summaries outline recent consensus views and selected house targets published in January and February 2026, together with the assumptions cited in the underlying research.
Stock Analysis (consensus overview)
Stock Analysis reports that 33 analysts covering Microsoft have a consensus 12-month price target of about $603.27, with individual estimates ranging from $392 at the low end to $675 at the high end. It characterises the aggregated recommendation as a Strong Buy. The service states that these targets reflect expectations for continued growth in Microsoft’s cloud and AI businesses, alongside assumptions about capital expenditure and cash generation in analyst models (Stock Analysis, 18 February 2026).
DailyForex (aggregated snapshot)
DailyForex cites an average analyst 12-month price target of roughly $599.58, based on a basket of broker estimates it tracks. It notes that this consensus sits within a broader range of individual targets and references AI-driven revenue growth and ongoing investment in data-centre capacity in supporting commentary (DailyForex, 2 February 2026).
Public.com (retail-focused consensus)
Public.com states that analysts have set a 12-month Microsoft price target around $595.90, indicating limited implied upside from the platform’s then-current reference price. The commentary links this aggregated figure to expectations for sustained demand for cloud services and productivity software, as well as Microsoft’s balance-sheet position and AI product roadmap (Public.com, 26 February 2026).
Goldman Sachs (broker rating)
Goldman Sachs reiterates a Buy rating on Microsoft with a 12-month price target of $600, trimming its objective from a previous $655 level. The bank states that the revised target reflects confidence in Microsoft’s cloud and AI positioning, while also acknowledging higher capital-expenditure requirements and a more volatile valuation backdrop for large-cap technology shares (Yahoo Finance, 25 February 2026).
MarketBeat (broker and consensus summary)
MarketBeat reports that The Goldman Sachs Group reissued its Buy rating on Microsoft with a $600 price objective as of 29 January 2026. Across the brokers it tracks, Microsoft carries a consensus rating of ‘Moderate Buy’ with a consensus price target near $601. It notes that most analysts maintain Buy-type recommendations, with a smaller number of Hold ratings, and highlights themes such as elevated AI and data-centre spending, peer comparisons, and valuation sensitivity when discussing potential risks and upside drivers (MarketBeat, 29 January 2026).
Fintel (consensus distribution)
Fintel reports a 12-month average MSFT stock forecast of $608.86. Individual targets range from $395.92 to $766.50. The service presents these figures in a structured forecast table, with the spread of estimates illustrating differing analyst assumptions about Microsoft’s growth trajectory and valuation over the coming year (Fintel, 24 February 2026).
Investing.com (broker poll consensus)
Investing.com indicates that, based on a poll of analyst reports over the past three months, Microsoft carries an overall Strong Buy consensus, with 54 Buy, three Hold and no Sell recommendations. It cites a 12-month price-target range from $392 at the low end to $730 at the high end, with an average around $596. The platform notes that this distribution reflects expectations for continued earnings growth, particularly in cloud and AI-related segments, while acknowledging sector-specific and macroeconomic risks referenced in broker research (Investing.com, 26 February 2026).
Predictions and third-party forecasts are inherently uncertain, as they cannot fully account for unexpected market developments. Past performance is not a reliable indicator of future results.
MSFT stock price: Technical overview
On the daily chart, the MSFT stock price is trading around $401.28 as of 2:20pm UTC on 26 February 2026. The price sits below the classic pivot near 447 and beneath the 50-, 100- and 200-day simple moving averages, located around 449, 477 and 486 respectively. The shorter 10-day SMA near 397 and the Hull moving average around 390 form an initial dynamic support zone. The 10-day EMA, near 399, tracks close to spot, while the 20-day EMA and VWMA, both just above 411, represent the first area of moving-average resistance.
The 14-day RSI, at around 39.6, sits in lower-neutral territory. An ADX reading near 36 suggests an established trend rather than range-bound conditions. On the upside, traders may monitor the classic R1 region near 473, with R2 around 516 coming into focus only if price secures a sustained daily close above the initial pivot area. On pullbacks, attention may turn to nearby support references, including the 10-day SMA and the Hull moving average, with a broader break lower exposing the S1 zone around 404.
This technical analysis is provided for informational purposes only and does not constitute financial advice or a recommendation to buy or sell any instrument.
(TradingView, 26 February 2026)
Microsoft share price history (2024–2026)
MSFT’s stock price has recorded sizeable swings over the past two years, moving from the low $400s into the mid-$500s before falling back below $400 and later stabilising near current levels. The stock closed at $406.33 on 28 February 2024, compared with $400.05 on 26 February 2025 and $401.52 on 26 February 2026. While it has traded within a broad range during this period, it is currently close to where it stood a year earlier.
Past performance is not a reliable indicator of future results. Share prices are indicative and may differ from live market prices.
Microsoft (MSFT): Capital.com analyst view
Microsoft’s share price has covered a wide range over the past two years, rising into the mid-$500s in 2025 before retreating towards the low $400s and more recently trading just above $400 as of late February 2026. This pattern illustrates how sentiment towards large US technology shares can shift in response to earnings results, AI-related developments, valuation considerations and changes in interest-rate expectations.
For CFD traders, Microsoft remains closely watched because it sits at the intersection of several structural themes, including cloud infrastructure spending, AI deployment, regulation of large platforms and overall risk appetite in US equity markets. A supportive technology backdrop or company-specific developments may coincide with upward price movements, while reassessments of growth assumptions or tighter macro conditions may coincide with declines. As a result, both short-term volatility and longer-term trends can develop in either direction.
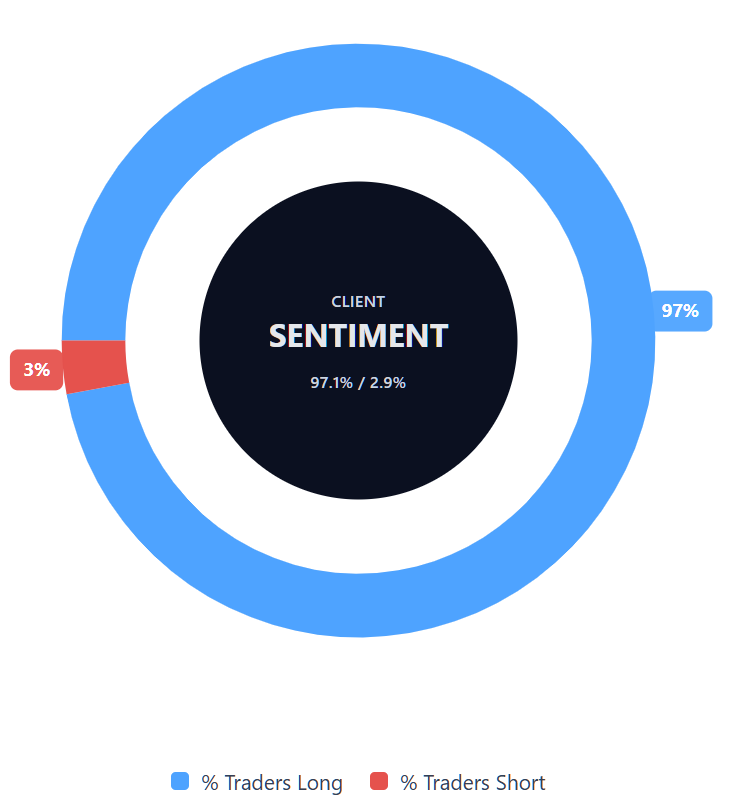
Capital.com’s client sentiment for Microsoft CFDs
As of 26 February 2026, Capital.com client positioning in Microsoft CFDs is currently skewed towards long positions, with 97.1% of clients holding buy positions compared with 2.9% holding sell positions. This represents a difference of around 94.2 percentage points. This snapshot reflects open positions on Capital.com at the time of writing and may change.
Summary – Microsoft 2026
- As of 2:20pm UTC on 26 February 2026, Microsoft was trading near $401.28, broadly in line with late-February 2025 levels after a mid-2025 move above $550.
- Daily technical indicators show price below the 50-, 100- and 200-day moving averages, with RSI around 40 and ADX above 25, pointing to an established trend backdrop without signalling extreme conditions.
- Key factors in focus include Microsoft’s cloud and AI performance (including Azure and Copilot metrics), broader large-cap technology sentiment, interest-rate expectations and shifts in risk appetite across US equity markets.
- Recent attention has centred on fiscal Q2 2026 results, cloud and Copilot adoption metrics, and sector developments such as Leonardo’s aerostructures joint venture plans, which contribute to the wider technology and aerospace context.
Past performance is not a reliable indicator of future results.
FAQ
Who owns the most Microsoft stock?
Microsoft’s largest shareholders are typically institutional investors such as global asset managers and index fund providers. Firms including Vanguard and BlackRock have historically held sizeable stakes through passive funds that track major US indices. Senior executives and board members may also hold shares as part of compensation packages. Ownership levels can change over time as funds rebalance portfolios or as insiders buy or sell shares.
What is the five-year Microsoft share price forecast?
There is no single agreed five-year MSFT stock forecast. Most publicly available analyst targets focus on a 12-month horizon rather than multi-year projections. Longer-term expectations tend to reflect assumptions about revenue growth in cloud and AI segments, capital expenditure plans, competitive positioning and broader macroeconomic conditions. Forecasts are inherently uncertain and can change as new financial results, industry developments or wider market trends emerge.
Is Microsoft a good stock to buy?
Whether Microsoft is considered a ‘good’ stock depends on your objectives, risk tolerance and investment timeframe. Analysts often highlight its position in cloud computing and enterprise software, while also noting valuation sensitivity and exposure to broader technology-sector conditions. The share price can fluctuate in response to earnings updates, regulatory developments and changes in interest-rate expectations. Any investment decision should take into account your personal circumstances and overall portfolio approach.
Could Microsoft stock go up or down?
Microsoft’s share price can move in either direction. Positive earnings surprises, stronger-than-expected cloud growth or supportive sentiment towards large-cap technology shares may coincide with upward movements. Conversely, weaker guidance, shifts in macroeconomic expectations or broader equity-market volatility may coincide with declines. Technical indicators, such as moving averages and momentum readings, can provide context for recent price behaviour, but they do not eliminate the risk of unexpected moves.
Should I invest in Microsoft stock?
Deciding whether to invest in Microsoft shares requires careful consideration of your financial goals, time horizon and tolerance for risk. Direct share ownership differs from trading derivatives such as CFDs, which involve leverage and carry a higher level of risk. This article provides market information and references third-party forecasts for educational purposes only and does not constitute investment advice. You should consider seeking independent financial advice before making investment or trading decisions.
Can I trade Microsoft CFDs on Capital.com?
Yes, you can trade Microsoft CFDs on Capital.com. Trading share CFDs lets you speculate on price movements without owning the underlying asset and to take long or short positions. However, contracts for difference (CFDs) are traded on margin, and leverage amplifies both profits and losses. You should ensure you understand how CFD trading works, assess your risk tolerance, and recognise that losses can occur quickly.