Intel stock forecast: SambaNova AI deal and foundry shift
Intel is a US semiconductor company whose shares reflect developments in AI partnerships, including its SambaNova deal, recent foundry leadership changes and broader chip-sector and macroeconomic trends. Explore third-party INTC price targets and technical analysis.
Intel Corporation (INTC) is trading near $44.58 as of 2:02pm UTC on 27 February 2026, moving within an intraday range between $44.49 and $46.92 on Capital.com’s feed. The price remains below recent session highs, with trading framed by ongoing volatility in large US semiconductor and AI-linked names. Past performance is not a reliable indicator of future results.
The stock is reacting to recent company developments, including Intel’s multi-year AI partnership with SambaNova, which involves combining SambaNova’s SN50 accelerators with Intel Xeon processors, alongside a related $350m Series E investment (DatacenterDynamics, 24 February 2026). Sentiment also appears sensitive to leadership changes following reports that Intel Foundry senior leader Kevin O’Buckley is leaving for a role at Qualcomm, with Intel appointing Naga Chandrasekaran to lead the foundry business as part of its strategic pivot (Tom's Hardware, 26 February 2026). Broader chip-sector moves linked to AI demand, competition with Nvidia and AMD, and the market’s focus on upcoming US macroeconomic data continue to influence intraday price action in Intel shares (Reuters, 25 February 2026).
Intel stock forecast 2026–2030: Third-party price targets
As of 27 February 2026, third-party Intel stock predictions span the mid-$40s to high-$40s, with some sources describing limited implied upside or downside relative to prevailing prices at the time of publication. The summaries below outline third-party estimates released in February 2026, highlighting stated targets, ranges and the assumptions referenced by analysts.
Fintel (consensus average)
Fintel reports that the average one-year INTC stock forecast was revised to $46.99. It notes that this consensus – based on analyst targets ranging from $20.60 to $75.08 – represented a small discount to the then-latest closing price and reflected uncertainty around foundry execution and AI-server growth (Fintel, 27 February 2026).
MarketBeat (broker consensus)
MarketBeat reports that brokers covering Intel assigned an average 12-month price target of approximately $45.74, alongside a consensus rating of Reduce. The service notes that this figure sits within a broad range of individual targets and that analysts continue to balance AI-related opportunities against execution risks in Intel’s foundry and data-centre strategies (MarketBeat, 27 February 2026).
Yahoo Finance (options-linked overview)
Yahoo Finance indicates that, as of 26 February 2026, Wall Street analysts collectively assigned Intel an average price target of around $48, implying limited movement relative to prevailing spot levels at the time. The article explains that options positioning and analyst commentary together point to a cautiously constructive stance, with market participants weighing potential AI and data-centre growth against margin pressure and capital-intensity risks (Yahoo Finance, 26 February 2026).
Tikr (implied upside snapshot)
Tikr notes that the consensus mean Intel price target stands near $47.12 compared with a $44.11 close, implying an estimated 6.8% difference between spot and target at that time. It highlights that targets from 41 analysts ranged from $20.40 to $71.50, underlining diverging expectations regarding Intel’s AI server momentum and foundry ambitions (Tikr, 23 February 2026).
Predictions and third-party forecasts are inherently uncertain, as they cannot fully account for unexpected market developments. Past performance is not a reliable indicator of future results.
INTC stock price: Technical overview
The INTC stock price trades near $44.58 as of 2:02pm UTC on 27 February 2026, positioned below a near-term cluster of moving averages on the daily chart. The simple 20-, 50-, 100- and 200-day moving averages sit around 47, 44, 41 and 32 respectively. The price has moved below the shorter-term 20-day average while remaining above the 50- and 100-day lines, indicating mixed short- and medium-term signals.
The 14-day relative strength index (RSI) reads around 48.6, placing momentum in neutral territory. Meanwhile, an average directional index (ADX) reading near 15 suggests a weak, non-directional trend rather than a sustained directional move.
On the upside, the nearest classic resistance level stands around 48.0 (R1). A move above that area would bring the next resistance band near 63.1 (R2) into focus. On pullbacks, the classic pivot near 46.3 may act as initial support, followed by the 100-day simple moving average in the low-41 region. A break below that zone could expose the S1 area around 38.0 (TradingView, 27 February 2026).
This technical analysis is provided for informational purposes only and does not constitute financial advice or a recommendation to buy or sell any instrument.
Intel share price history (2024–2026)
INTC’s stock price has reset significantly over the past two years, moving from the low-$20s in early 2025 to the mid-$40s by late February 2026. The stock closed at approximately $23.84 on 28 February 2025 and trended higher through the year, finishing 2025 near $36.93 on 31 December. By 27 February 2026, Intel had extended those gains to close around $44.80, marking a substantial year-on-year increase from late-February 2025 levels, despite periodic volatility around the mid-$40s.
Past performance is not a reliable indicator of future results. Share prices are indicative and may differ from live market prices.
Intel (INTC): Capital.com analyst view
Intel’s share price has recovered over the past two years, rising from the low-$20s in early 2025 to trade in the mid-$40s by late February 2026. The move has coincided with renewed market attention on AI-related hardware and foundry services, alongside volatility around earnings releases, competitive developments and broader swings in US technology indices.
Looking ahead, Intel’s price may remain sensitive to changes in expectations around AI demand, capital expenditure and progress in its foundry strategy. While some market participants view these areas as potential longer-term growth drivers, others focus on margin pressure and cash-flow risks if execution falls short of expectations.
Macro factors – including US interest-rate expectations, inflation data and overall risk appetite – could also influence price direction. Supportive conditions for cyclical and technology shares may coincide with stronger equity performance, while renewed policy or geopolitical uncertainty could weigh on valuations. These factors can operate in either direction and may increase volatility.
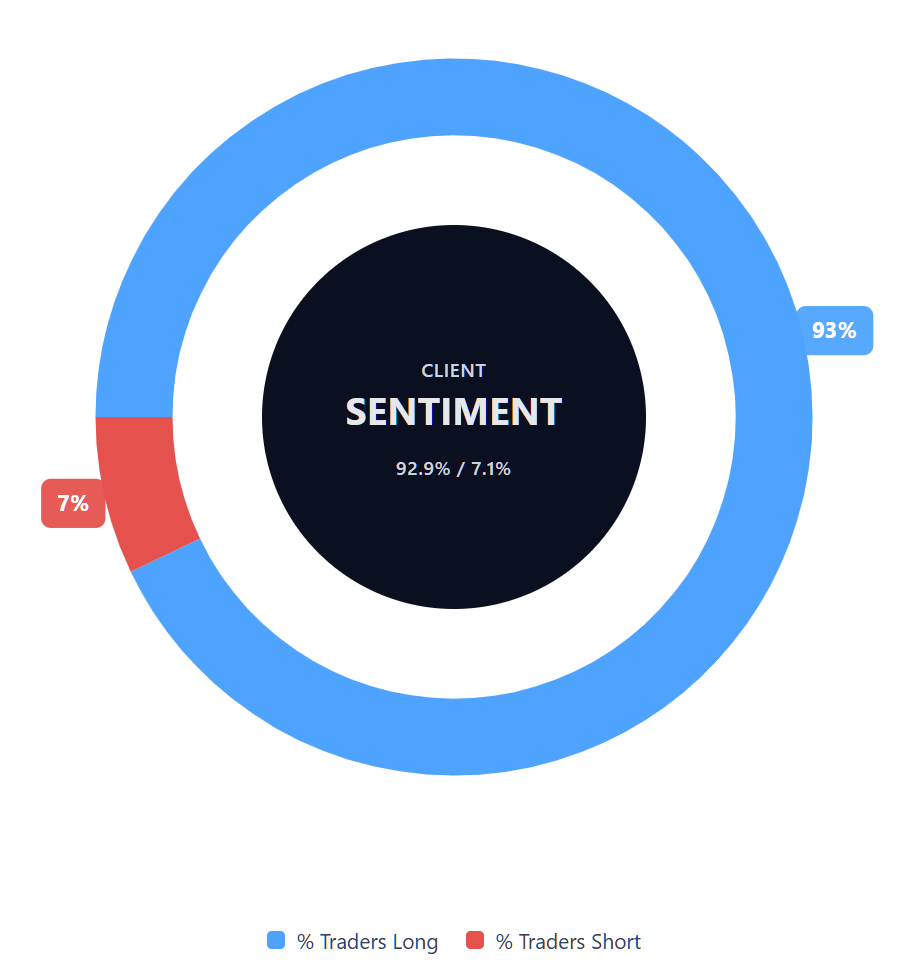
Capital.com’s client sentiment for Intel CFDs
As of 27 February 2026, Capital.com client positioning in Intel CFDs shows a strong skew towards long positions, with 92.9% of clients holding long exposure compared with 7.1% holding short positions – a difference of approximately 85.8 percentage points. This distribution indicates concentrated long positioning at the time of writing. The data reflects open positions on Capital.com and may change.
Summary – Intel 2026
- As of 2:02pm UTC on 27 February 2026, Intel traded near $44.58, well above levels seen in late February 2025.
- Daily technical indicators show the price below the 20-day moving average but above the 50- and 100-day averages, with RSI in neutral territory and ADX pointing to a weak trend.
- Key drivers include evolving expectations for AI-server demand, Intel’s capital-intensive foundry strategy, sector competition and broader movements in US technology stocks and macroeconomic sentiment.
- Recent developments include Intel’s AI partnership with SambaNova, leadership changes within its foundry division and updated analyst price targets that generally cluster in the mid-$40s to high-$40s range, albeit with a wide dispersion of views.
Past performance is not a reliable indicator of future results.
FAQ
Who owns the most Intel stock?
Intel’s largest shareholders are typically major institutional investors, such as asset managers and index fund providers, including firms like Vanguard and BlackRock, which hold shares on behalf of their clients. Ownership levels can change as funds rebalance portfolios or adjust exposure to the semiconductor sector. Company insiders, including executives and board members, also hold smaller stakes. Investors can review the latest regulatory filings to access the most recent publicly available breakdown of ownership.
What is the 5-year Intel share price forecast?
There is no single agreed five-year Intel share price forecast. Analyst estimates referenced in this article focus primarily on 12-month targets, with a wide dispersion of views reflecting uncertainty around AI demand, foundry execution and capital expenditure. Longer-term projections depend on variables such as competitive positioning, operating margins, macroeconomic conditions and technology cycles. Any long-term forecast is therefore conditional on assumptions that may change over time, and should be treated as scenario-based estimates rather than precise predictions.
Is Intel a good stock to buy?
Whether Intel is considered a ‘good’ stock depends on an individual’s objectives, risk tolerance and time horizon. Analysts currently present mixed views, balancing potential AI and data-centre growth against execution and margin risks. Share prices in the semiconductor sector can be volatile, particularly around earnings releases and industry developments. Investors typically assess company fundamentals, valuation metrics, competitive dynamics and broader market conditions before making decisions. This information is for educational purposes only and does not constitute investment advice.
Could Intel stock go up or down?
Intel’s share price can move in either direction depending on company performance, sector developments and macroeconomic factors. Expectations around AI-related revenue, progress in its foundry strategy, competition with other chipmakers and shifts in interest-rate outlooks may all influence price action. Technical indicators currently show mixed signals, with neutral momentum readings and a weak trend profile. As with all listed shares, price volatility can occur over both the short and longer term.
Should I invest in Intel stock?
Deciding whether to invest in Intel stock requires careful consideration of personal financial circumstances, investment goals and risk appetite. Semiconductor shares can experience sharp price movements, influenced by earnings results, industry cycles and broader equity market sentiment. Some market participants seek long-term exposure, while others focus on shorter-term price movements through different instruments. You may wish to carry out independent research and, where appropriate, seek advice from a qualified financial adviser before making any investment decision.
Can I trade Intel CFDs on Capital.com?
Yes, you can trade Intel CFDs on Capital.com. Trading share CFDs lets you speculate on price movements without owning the underlying asset and to take long or short positions. However, contracts for difference (CFDs) are traded on margin, and leverage amplifies both profits and losses. You should ensure you understand how CFD trading works, assess your risk tolerance, and recognise that losses can occur quickly.