Trump Media & Technology Group stock forecast: Third-party price targets
Trump Media & Technology Group is a US-listed media company whose shares have shown high volatility and limited analyst coverage, with available price forecasts largely sourced from third-party models and scenario-based research. Explore third-party price targets and technical analysis.
Trump Media & Technology Group (DJT) is trading around $14.10 in intraday dealings on 21 January 2026, within a session range of $13.31–$14.78, according to Capital.com’s pricing feed as of 11:34am (UTC). Past performance is not a reliable indicator of future results.
Recent trading comes amid a series of corporate announcements, including Trump Media’s plan for an all-stock merger with fusion technology company TAE Technologies, valued at more than $6bn, and targeting completion in mid-2026, subject to shareholder and regulatory approvals. Related disclosures also outline interim funding of up to $300m for TAE (GlobeNewswire, 18 December 2025). The share-price action follows the company’s 20 January 2026 announcement of a 2 February 2026 record date for a digital token initiative in partnership with Crypto.com, with eligible shareholders expected to receive further details on token allocation and potential utility or rewards linked to Truth Social, Truth+ and other products (GlobeNewswire, 20 January 2026).
Trump Media & Technology Group stock forecast 2026–2030: Third-party price targets
As of 21 January 2026, third-party Trump Media & Technology stock predictions continue to emphasise high uncertainty, with scenarios shaped by political sentiment, the company’s evolving business mix and technical or quantitative models rather than traditional earnings-based valuation. Recent projections and commentary published between December 2025 and January 2026 point to wide potential price ranges and repeatedly characterise the stock as speculative and event-driven.
Benzinga (bull/bear framework)
Benzinga presents qualitative bull and bear cases for DJT alongside numerical scenario bands. It cites 2026 projections that include a bullish case around $13.87, an average scenario near $8.25 and a bearish outcome close to $4.88, with longer-dated 2030 scenarios pointing to lower ranges. The article explains that these paths reflect assumptions about Truth Social’s ability to monetise its politically focused user base, the influence of meme-style trading, and the risk that continued net losses, concentrated audiences and legal or reputational developments could keep valuation under pressure (Benzinga, 18 December 2025).
CoinCodex (algorithmic ranges)
CoinCodex, using an algorithmic model, publishes monthly minimum, average and maximum DJT stock forecasts. Its 2026 ranges span from roughly $5.03–$5.54 in December to highs near $13.91 in January, while modelled averages for 2030 trend lower toward approximately $1.31–$3.75 by year-end. The platform notes that these figures are derived from historical volatility, technical indicators and cyclical patterns, and adds that its latest signal categorises sentiment as bearish, despite a relatively high proportion of recent positive trading days (CoinCodex, 21 January 2026).
The Motley Fool (momentum and event risk)
The Motley Fool reports that DJT gained around 14.7% in December and remained roughly 5% higher in early 2026, without assigning a formal price target. The analysis links recent momentum to Trump Media’s announcement of a planned $6bn all-stock merger with TAE Technologies and a proposed shareholder token distribution, while also cautioning that the company continues to generate limited revenue and that the commercial viability of its fusion and crypto-related initiatives remains uncertain (The Motley Fool, 12 January 2026).
Predictions and third-party forecasts are inherently uncertain, as they cannot fully account for unexpected market developments. Past performance is not a reliable indicator of future results.
DJT stock price: Technical overview
The DJT stock price is trading around $14.10 as of 11:34am (UTC) on 21 January 2026, with price hovering close to the classic pivot at 13.56 after an intraday range between 13.31 and 14.78. The simple moving-average cluster on the daily chart places the 20-, 50-, 100- and 200-day SMAs at roughly 14.0, 12.5, 14.5 and 17.4 respectively, leaving the shorter-term averages broadly supportive below spot while the 100- and 200-day measures remain overhead as potential medium-term resistance. The 14-day RSI, at around 54.1, sits in neutral territory, while an ADX reading near 24.7 points to a modestly developed trend, consistent with consolidation rather than a strong directional phase.
On the topside, the nearest classic resistance is R1 at 16.77, with R2 near 20.29 coming into focus only if DJT can post a firm daily close above the first level. On pullbacks, the Classic pivot at 13.56 acts as initial support, followed by the 100-day SMA near 14.5 as the next notable moving-average reference. A sustained break below this zone could open the way toward S1 at 10.04 if selling pressure intensifies (TradingView. 21 January 2026).
This technical analysis is provided for informational purposes only and does not constitute financial advice or a recommendation to buy or sell any instrument.
Trump Media & Technology share price history (2024–2026)
DJT’s stock price has been highly volatile over the past two years, moving between sharp post-listing rallies and deep pullbacks as sentiment shifted. DJT closed at $50.75 on 23 January 2024, after briefly spiking intraday to $58.72 during its early trading phase, before trending lower through the remainder of 2024 and ending the year at $34.34 on 31 December. That decline accelerated into 2025, with the price falling from $34.32 on 1 January to below $20 by mid-April, followed by a short-lived rebound into the high-$20s and low-$30s. A more persistent slide then took the stock from the low-$20s in late March to around $11 by early December.
Since mid-December 2025, DJT has stabilised in the low- to mid-teens, rebounding from $10.51 on 17 December to finish the year at $13.26, before trading largely between approximately $13.5 and $14.8 through January 2026. As of 21 January 2026, the stock stood at $14.10, leaving it well below its early-2024 peaks but modestly above the December 2025 lows, suggesting a period of consolidation following a prolonged drawdown.
Past performance is not a reliable indicator of future results. Share prices are indicative and may differ from live market prices.
Trump Media & Technology (DJT): Capital.com analyst view
Trump Media & Technology Group’s DJT share price has spent the past two years moving within a wide range, from brief surges above $60 in early trading to stabilising in the low- to mid-teens by January 2026. Price action has often coincided with political developments and company-specific announcements, with rallies at times fading as attention shifts or broader risk sentiment cools. Trading around $14.10 as of 21 January 2026, DJT remains well below earlier highs, illustrating how momentum in politically linked, retail-driven stocks can unwind as conditions change.
From a fundamental perspective, Trump Media remains in an early-stage, loss-making phase, reporting a net loss of approximately $401m on revenue of around $3.6m in 2024. This profile can leave valuation sensitive to shifts in growth expectations and funding conditions. Potential supportive factors include product expansion beyond Truth Social into fintech initiatives such as Truth.Fi and values-based investment products, which could diversify the business if adoption improves. At the same time, execution risk, regulatory scrutiny and competitive pressures across social media and financial services may constrain user growth and monetisation, limiting longer-term earnings visibility. Elevated volatility relative to the broader market means political or legal headlines can trigger sharp moves in either direction, underlining that news flow can act as both a positive and negative catalyst.
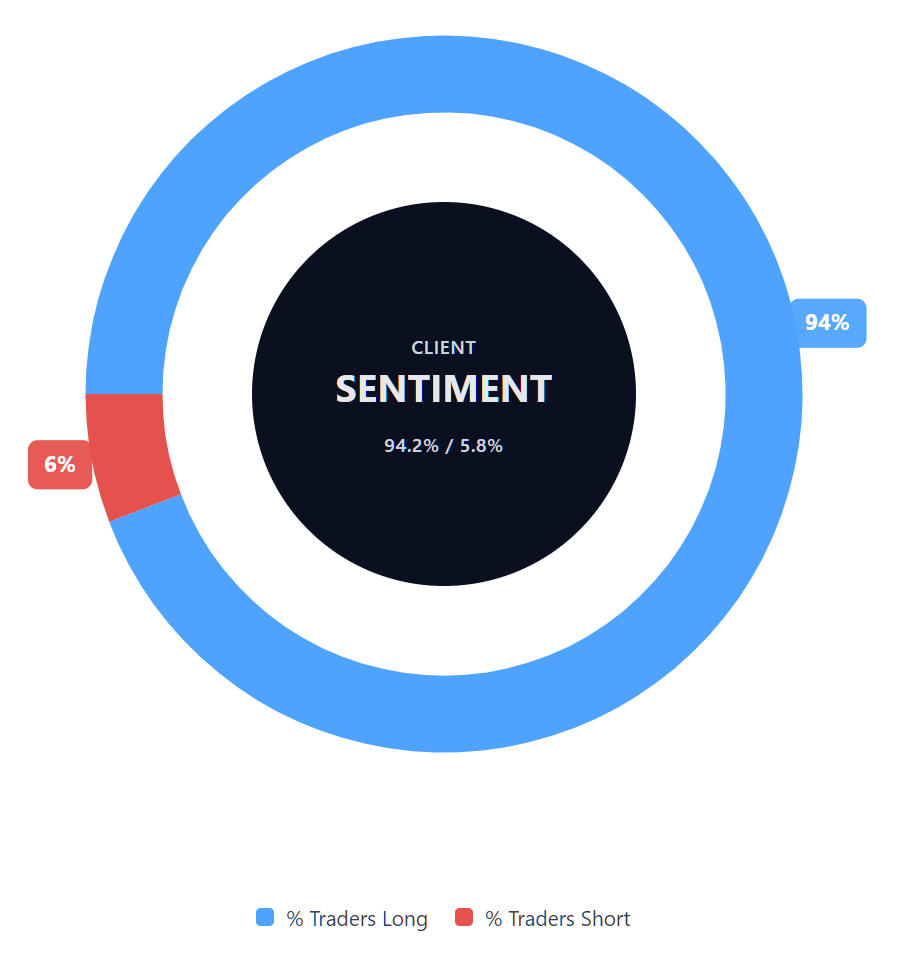
Capital.com’s client sentiment for Trump Media & Technology CFDs
As of 21 January 2026, Capital.com client positioning in Trump Media & Technology CFDs is heavily skewed toward long positions, with 94.2% buyers versus 5.8% sellers. This places net long positioning at roughly 88.5 percentage points in favour of buyers. These figures reflect open positions on Capital.com at the time of reporting and can change.
Summary – Trump Media & Technology Group 2026
- Trump Media & Technology Group (DJT) last traded at $14.10 as of 11:34am (UTC) on 21 January 2026, within an intraday range of $13.31–$14.78.
- Over the past two years, DJT has moved from early-2024 spikes above $60 to trading in the low- to mid-teens by late 2025 and January 2026, highlighting pronounced volatility.
- The 20-, 50-, 100- and 200-day simple moving averages sit near $14.0, $12.5, $14.5 and $17.4 respectively, with RSI close to 54 indicating mid-range momentum and a market that appears to be consolidating rather than trending strongly.
- Recent developments as of 21 January 2026 have included sizeable losses alongside low revenue, expansion efforts around Truth Social and fintech initiatives, and a planned merger with fusion firm TAE Technologies, all of which represent potential but uncertain influences on future performance.
Past performance is not a reliable indicator of future results.
FAQ
Who owns the most Trump Media & Technology Group stock?
Public disclosures indicate that Trump Media & Technology Group has a relatively concentrated ownership structure, with a significant portion of shares held by insiders, including entities linked to Donald Trump, alongside early backers and some institutional holders. Exact ownership levels can change over time due to lock-up expiries, secondary offerings or share sales. Retail ownership is also notable, reflecting the stock’s profile among individual traders rather than broad-based institutional coverage.
What is the five-year Trump Media & Technology share price forecast?
There is no widely accepted five-year DJT stock forecasts, as formal coverage from major Wall Street analysts remains limited. Longer-term projections that do exist tend to come from third-party quantitative models or scenario-based research, which rely on assumptions about future growth, funding and market conditions. These estimates can vary widely and should be viewed as illustrative rather than predictive, given the stock’s volatility and evolving business profile.
Is Trump Media & Technology a good stock to buy?
Whether Trump Media & Technology is considered attractive depends on individual circumstances, risk tolerance and objectives. The company operates in an early-stage, loss-making phase, with its share price historically showing sharp swings linked to news flow and sentiment. Some market participants focus on potential growth initiatives, while others emphasise execution risk, regulatory scrutiny and limited earnings visibility. This content is informational in nature and does not assess suitability or provide a recommendation to buy or sell the stock.
Could Trump Media & Technology stock go up or down?
Trump Media & Technology’s share price has shown pronounced volatility, meaning it has the potential to move sharply in either direction. Price changes have historically coincided with corporate announcements, political developments and shifts in broader market sentiment. Future movements may also reflect progress on business initiatives, funding conditions or regulatory outcomes. As with any traded instrument, price direction is uncertain, and both gains and losses are possible over different time horizons.
Should I invest in Trump Media & Technology stock?
Decisions about investing in Trump Media & Technology stock depend on personal financial goals, experience and risk appetite. The company’s limited analyst coverage, early-stage financial profile and elevated volatility may not suit all market participants. Before making any investment decision, it may be useful to consider the risks involved, review publicly available information and, where appropriate, seek independent advice. This article is for informational purposes only and does not provide investment advice.
Can I trade Trump Media & Technology CFDs on Capital.com?
Yes, you can trade Trump Media & Technology CFDs on Capital.com. Trading share CFDs lets you speculate on price movements without owning the underlying asset and to take long or short positions. However, contracts for difference (CFDs) are traded on margin, and leverage amplifies both profits and losses. You should ensure you understand how CFD trading works, assess your risk tolerance, and recognise that losses can occur quickly.