S&P 500 Breaks Technical Support as Event Risk Looms
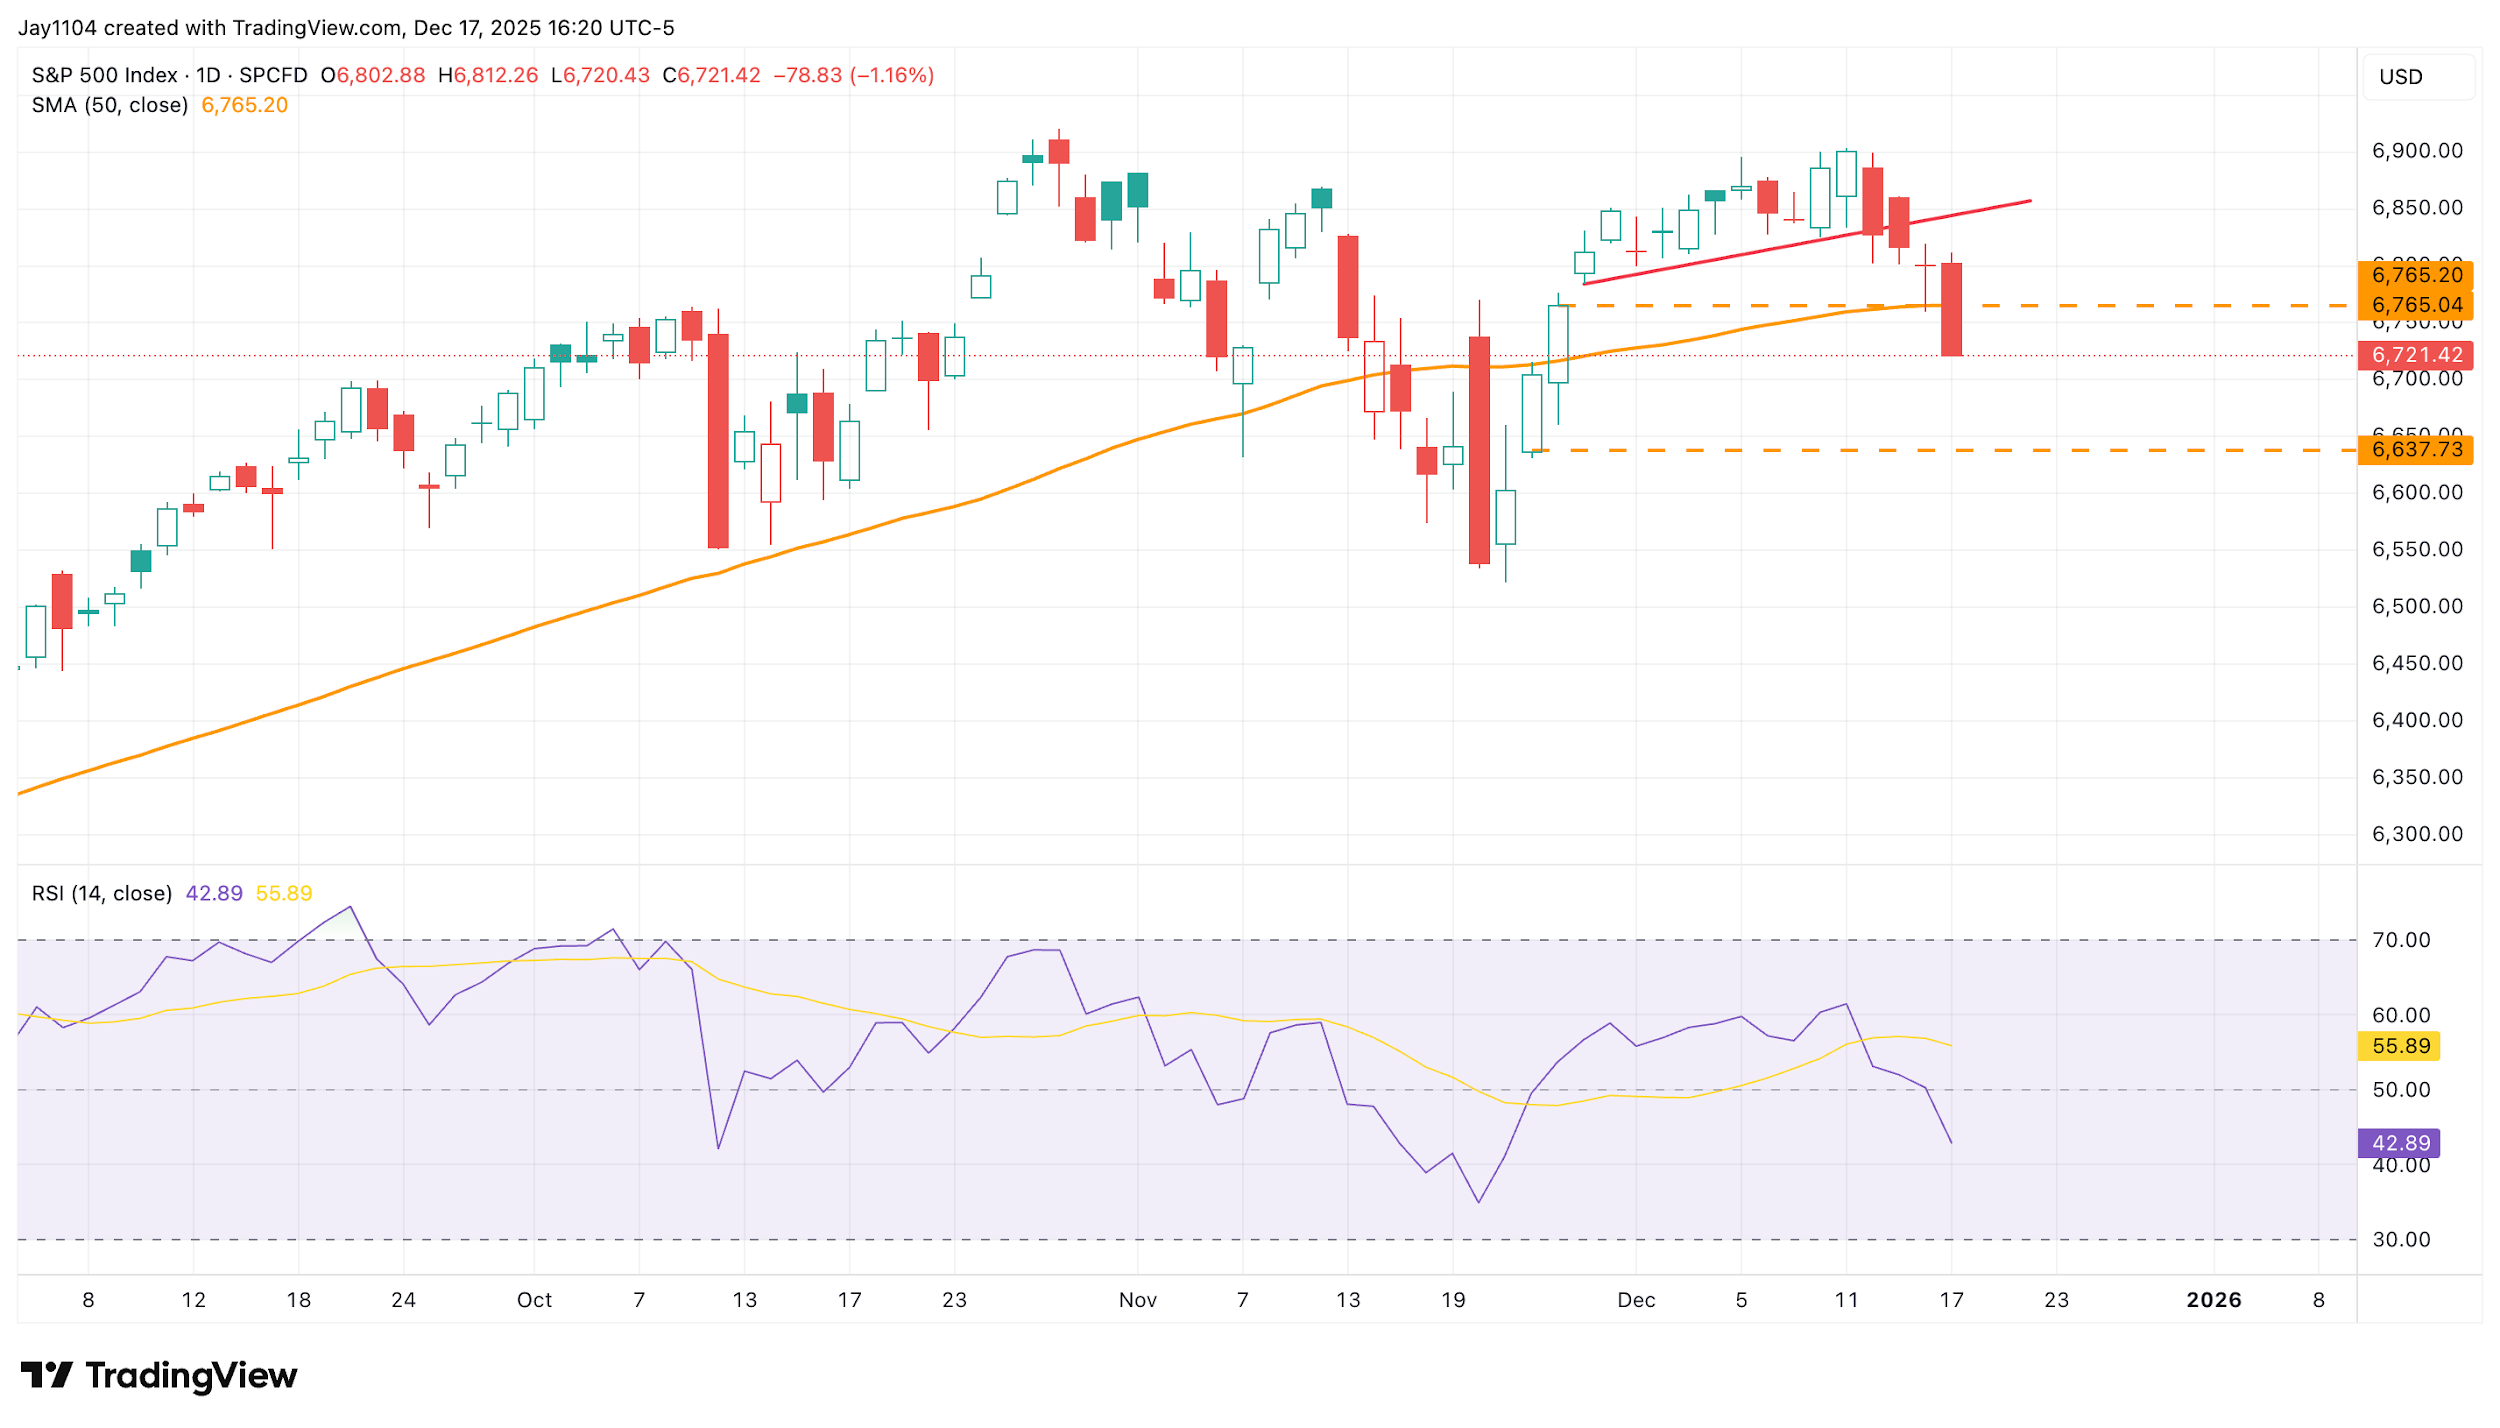
The S&P 500 fell by more than 1% on Wednesday, 17 December, breaking through technical support at 6,765, which also coincides with the 50-day simple moving average.
As a result, the index is trading below its 50-day moving average and below the technical support level of approximately 6,765. [Chart1] Should selling pressure persist when trading resumes on Thursday, 18 December, the door to further declines is now open, with the potential for the index to drop to the next region of support, based on a gap created on 24 November.
(Source: TradingView)
Past performance is not a reliable indicator of future results.
[Chart1]
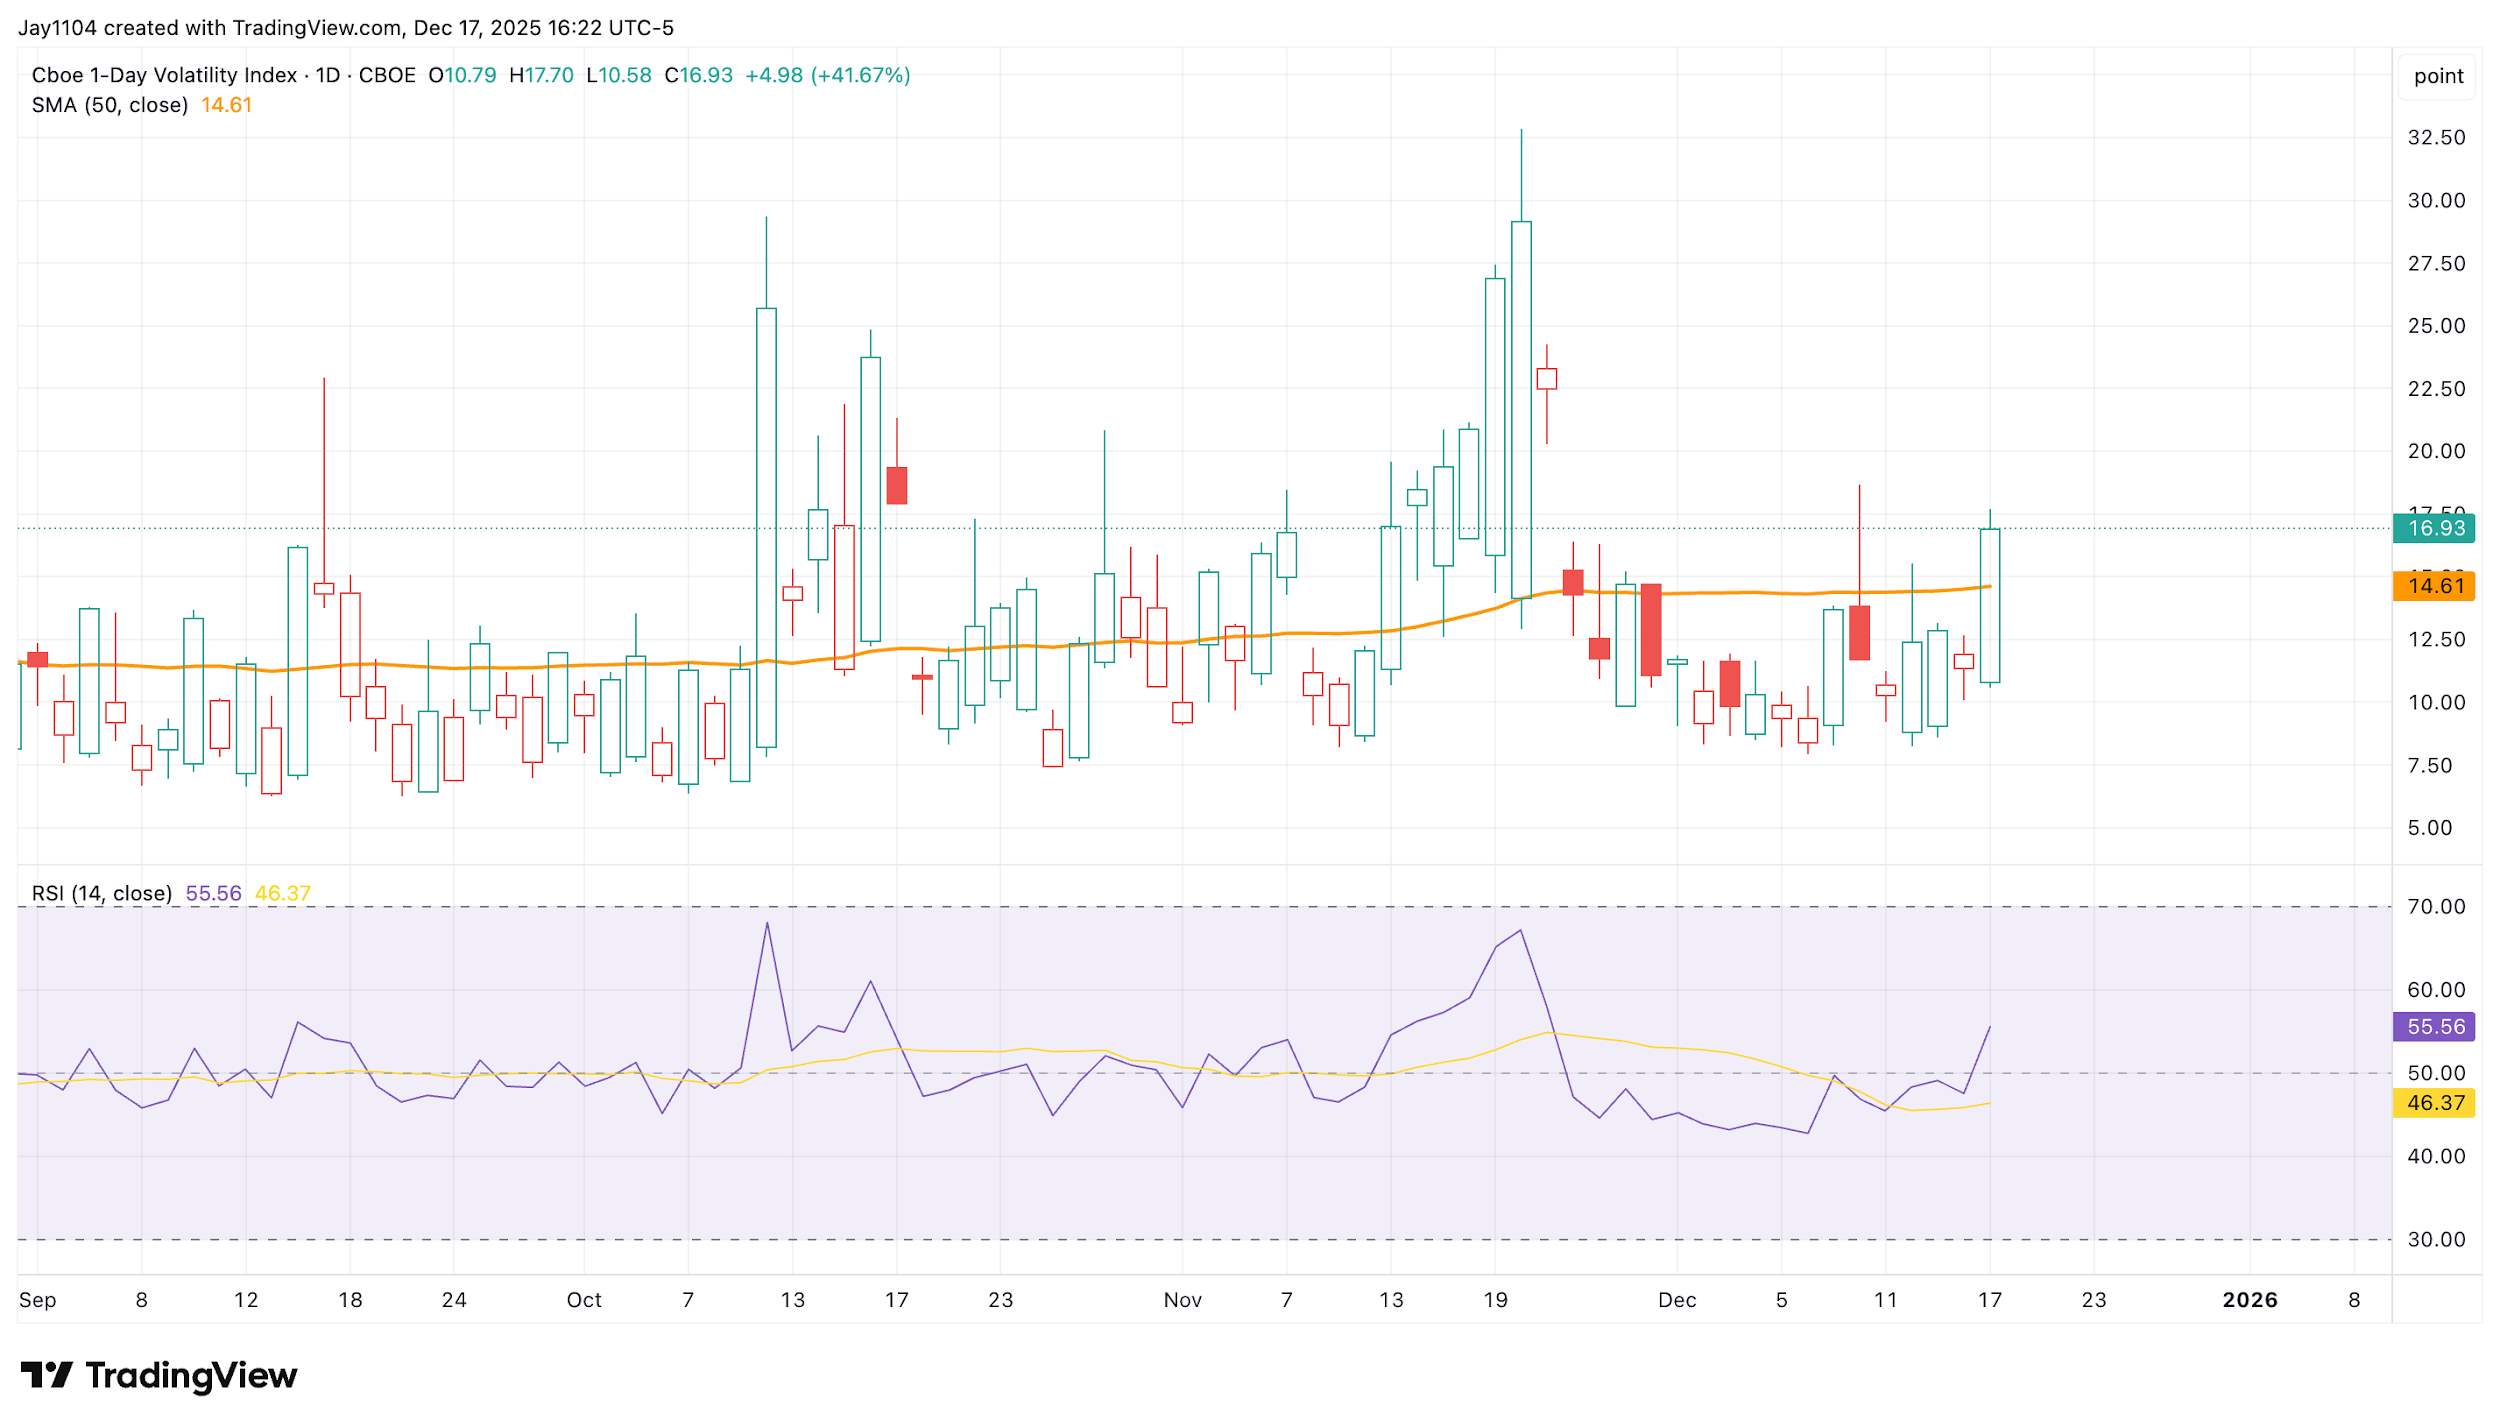
The complication is that Thursday, 18 December, brings a heavy slate of event risk, including policy decisions from the Bank of England and the European Central Bank, as well as the US CPI report. As a result, the VIX 1-day was bid up to about 17 by day’s end, and it is possible that, once event risk passes, implied volatility will decline. A stock market rebound could occur as mechanical flows unwind. [Chart2]
(Source: TradingView)
Past performance is not a reliable indicator of future results.
[Chart2]
US CPI Report
Analysts expect core CPI to increase by 0.3% month-on-month and 3.0% year-on-year. Headline CPI is also forecast to rise by 0.3% month-on-month, with the annual rate climbing to 3.1% (source: Investinglive). While a cooler-than-expected CPI report is unlikely to alter the outlook for Federal Reserve rate cuts in the US, a hotter-than-expected reading would clearly signal a significant red flag for markets. Such an outcome could trigger further selling of risk assets, as it underscores the view that rate cuts may be off the table for the foreseeable future, or until Jay Powell is no longer Fed chair.
In addition, it would increase the risk that Treasury yields rise again, thereby further pressuring risk assets. As a result, the outcome of this report could significantly affect equities and broader risk markets.
However, the US inflation report may not be the sole driver of interest rates. The ECB meeting is scheduled for Thursday, 18 December, around the same time as the CPI release. There has been speculation that the central bank could upgrade its growth forecast for the euro area in 2026, alongside discussion about a potential end to the rate-cutting cycle.
ECB’s Growth Outlook Will Be The Focus
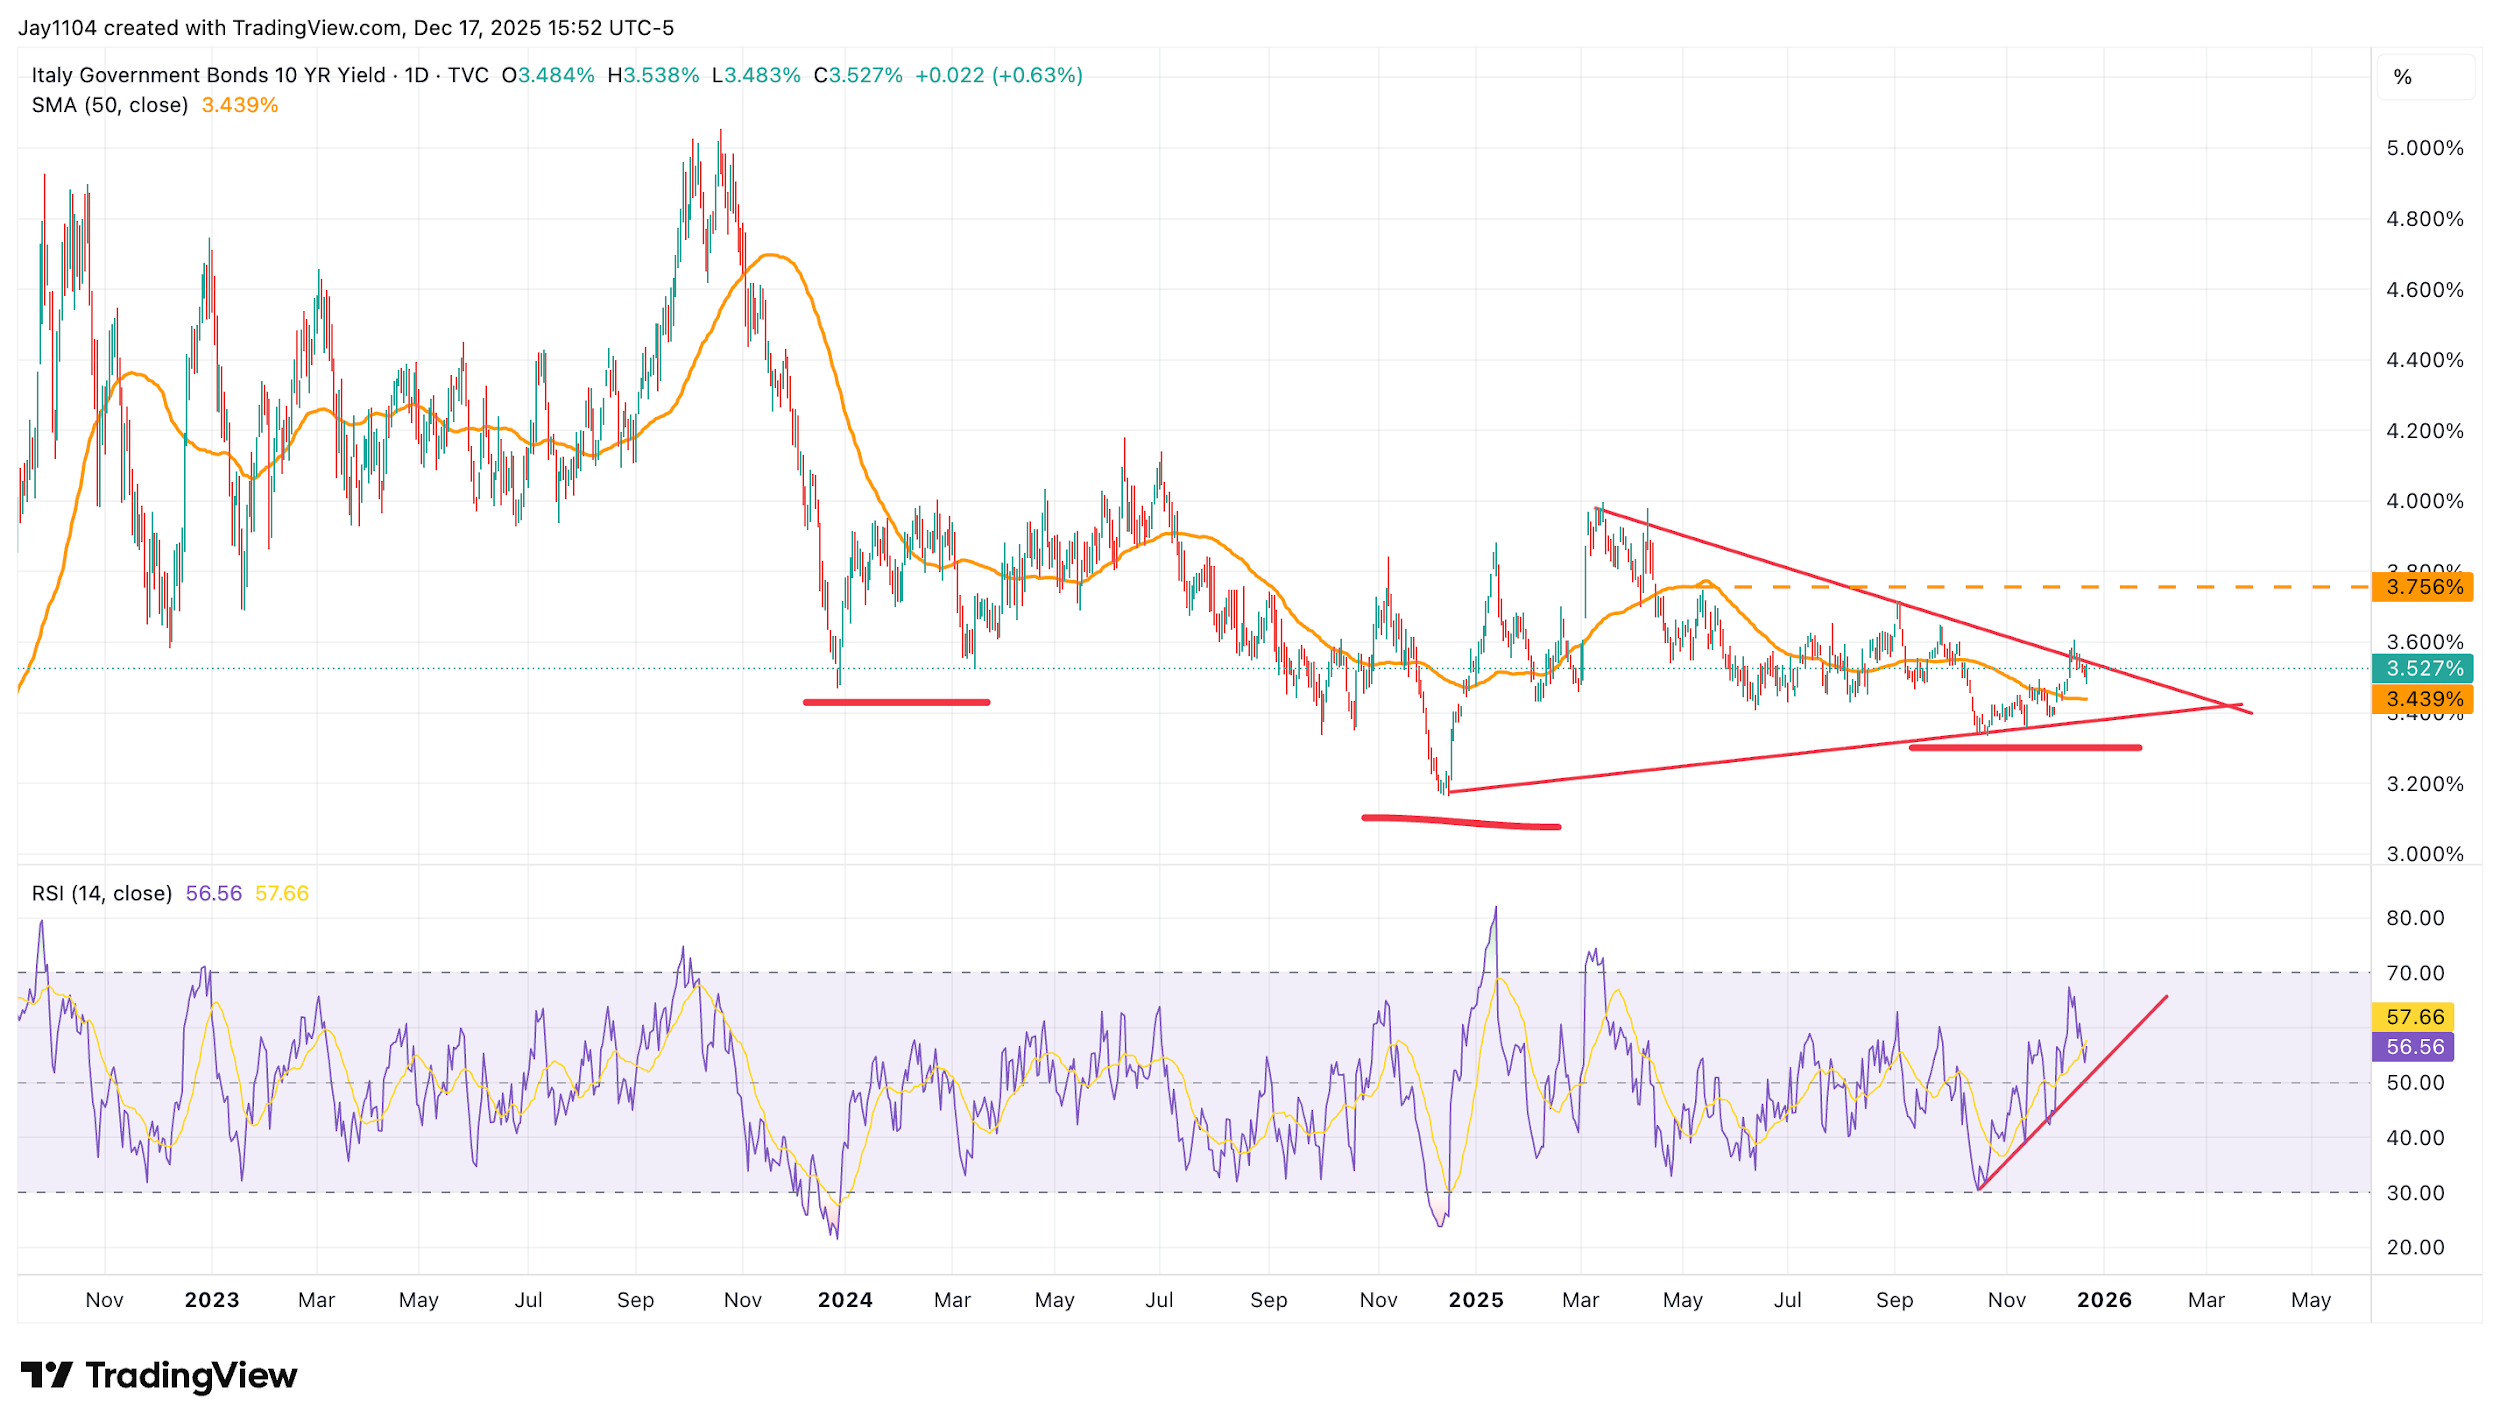
Should the ECB improve its growth outlook, European interest rates could begin to rise, as has been unfolding in Japan. For example, the Italian 10-year yield has recently been consolidating around 3.5% and appears close to a potential upside break. [Chart4] Should that occur, it could revert to 3.75% soon. The relative strength index has also been trending higher, suggesting that momentum has shifted toward higher rates.
(Source: TradingView)
Past performance is not a reliable indicator of future results.
[Chart4]
EURUSD Volatility
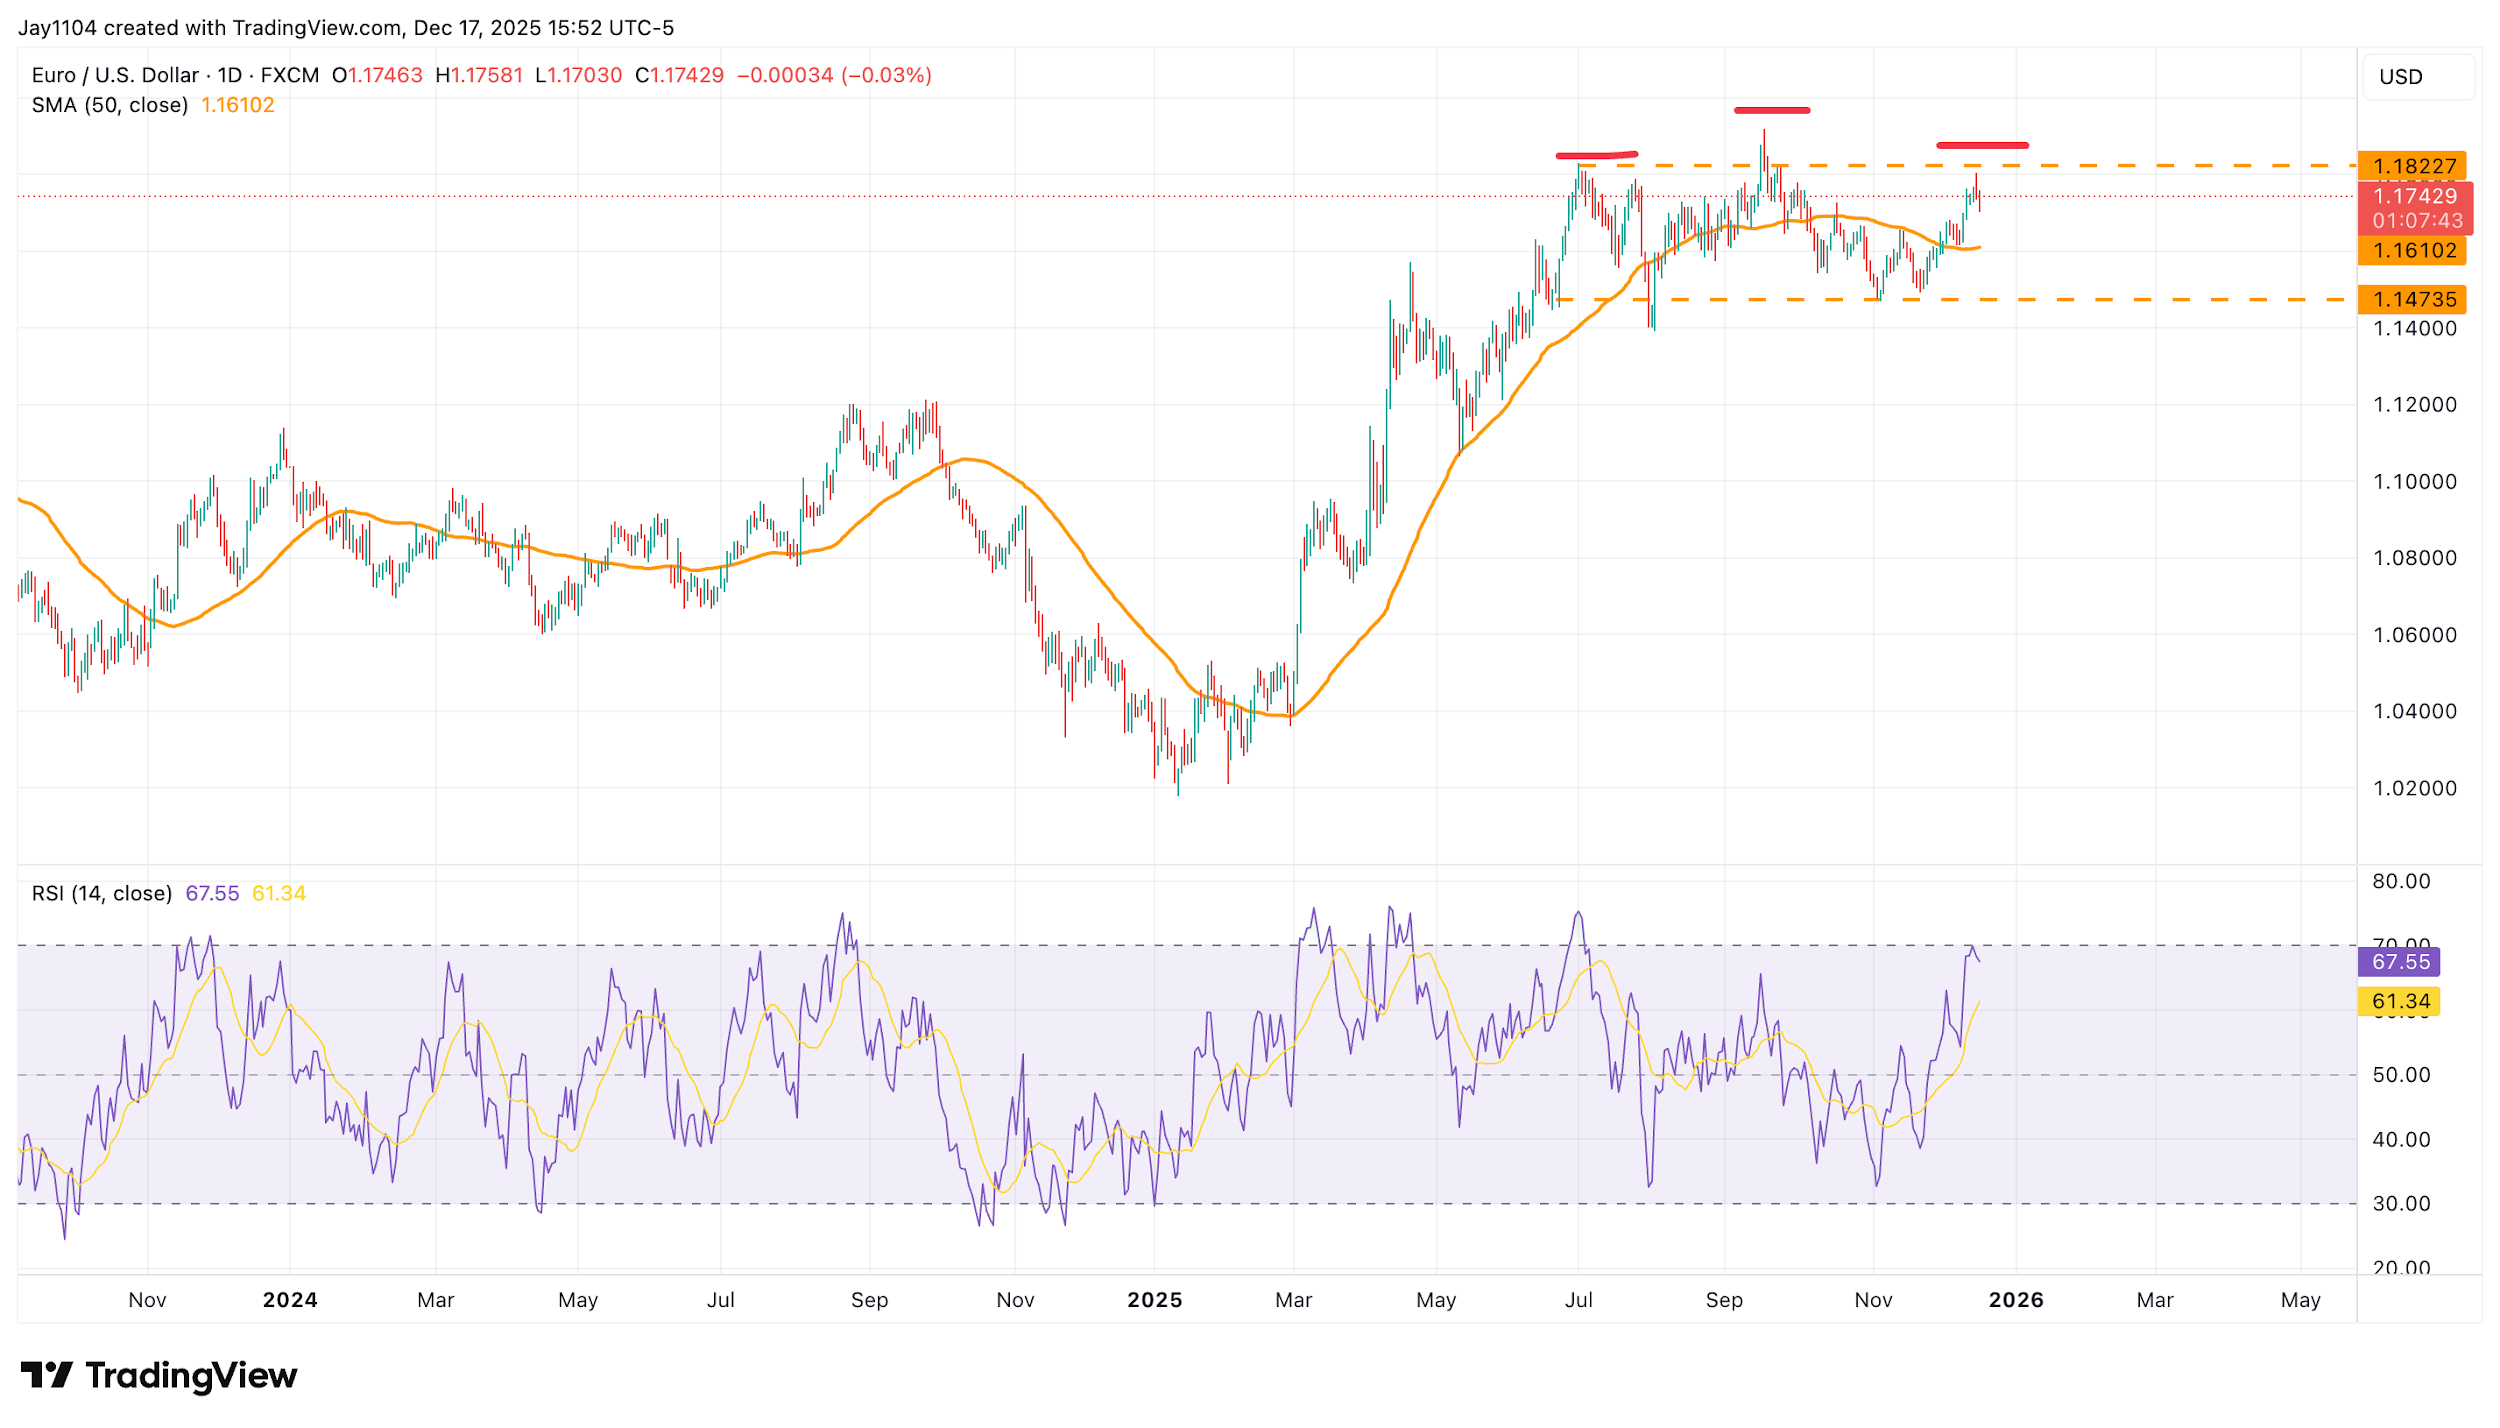
The US dollar could also experience significant volatility following the CPI report and the ECB meeting outcome, particularly against the euro. EUR/USD has yet to break decisively out of its trading range and therefore remains vulnerable to a potential head-and-shoulders pattern that has been developing over the past couple of weeks.
To invalidate this pattern, EUR/USD would need to move above the mid-September highs at around 1.19. Otherwise, a move lower could confirm the formation of a head-and-shoulders pattern, in which case attention would turn to a potential break below 1.1470. [Chart5]
(Source: TradingView)
Past performance is not a reliable indicator of future results.
[Chart5]
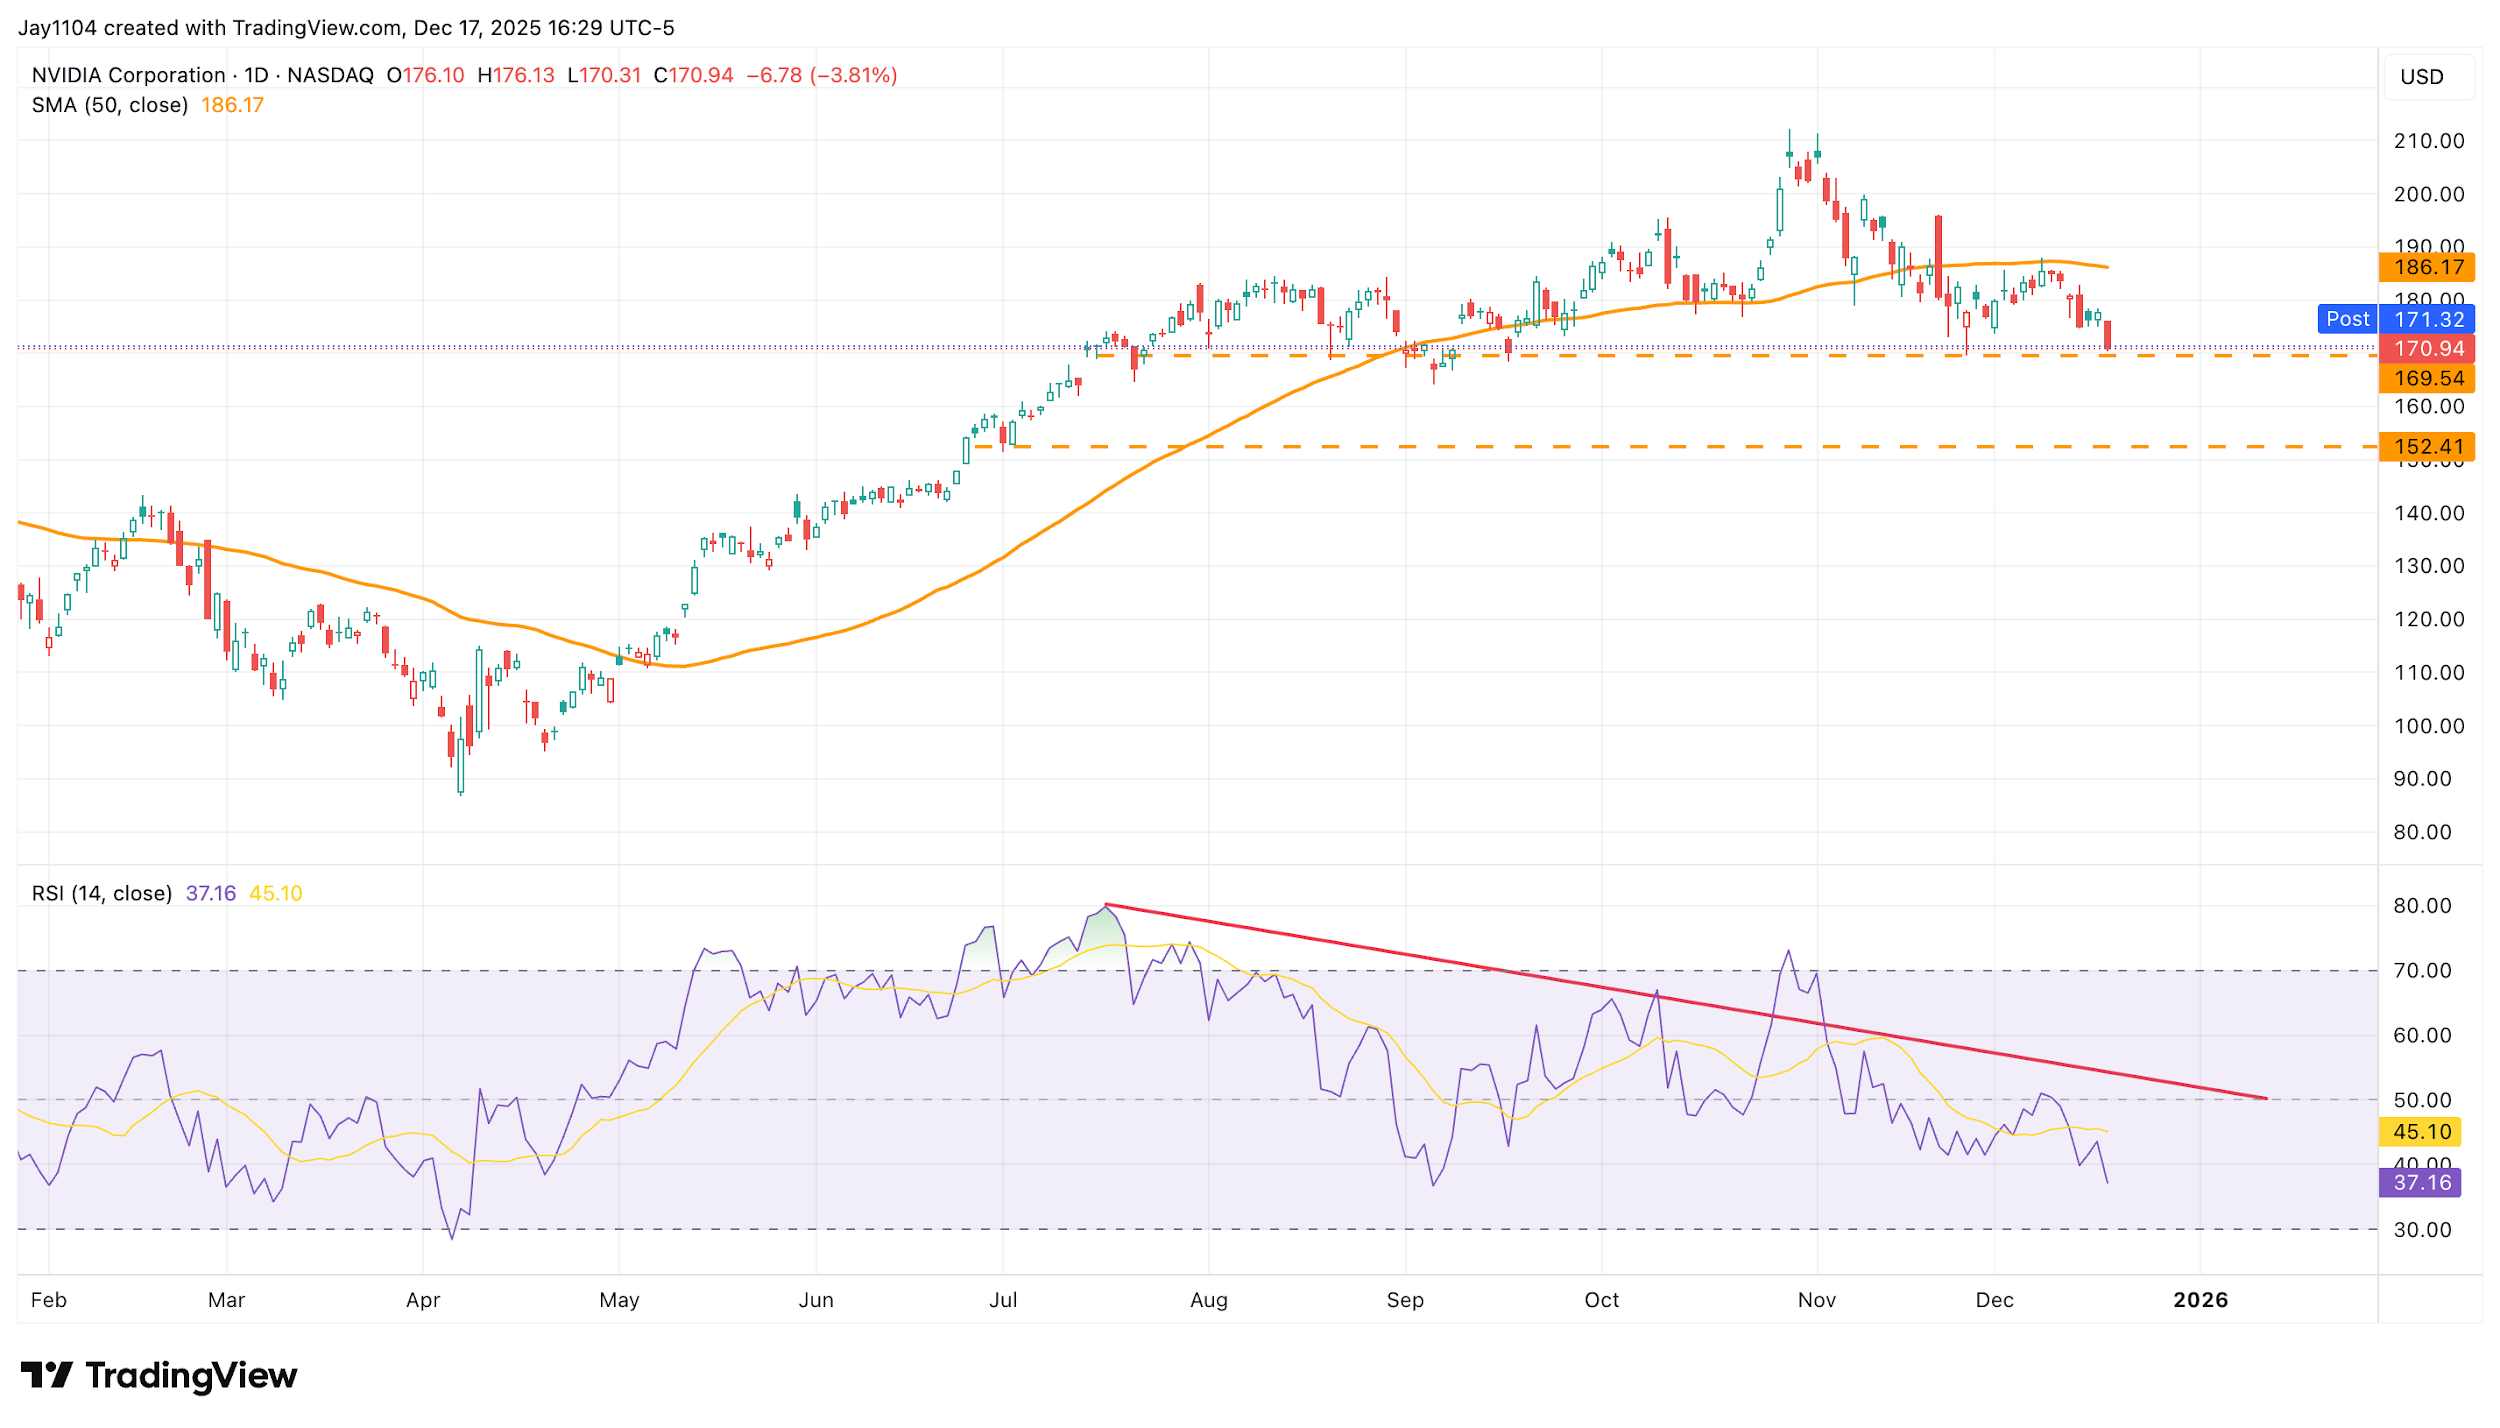
NVIDIA is at an Important Support Level
Finally, NVIDIA fell by nearly 4% on 17 December and is now approaching a technical support level at approximately $170. This has been an essential level of support for Nvidia since July. A break below this level could trigger a further decline in the stock price, potentially pushing the shares down towards $150 in the near term. [Chart6]
Momentum has clearly deteriorated, with a bearish divergence evident as the RSI has formed lower highs and continues to trend lower. This suggests that momentum has recently shifted more bearishly for the stock.
(Source: TradingView)
Past performance is not a reliable indicator of future results.
[Chart6]